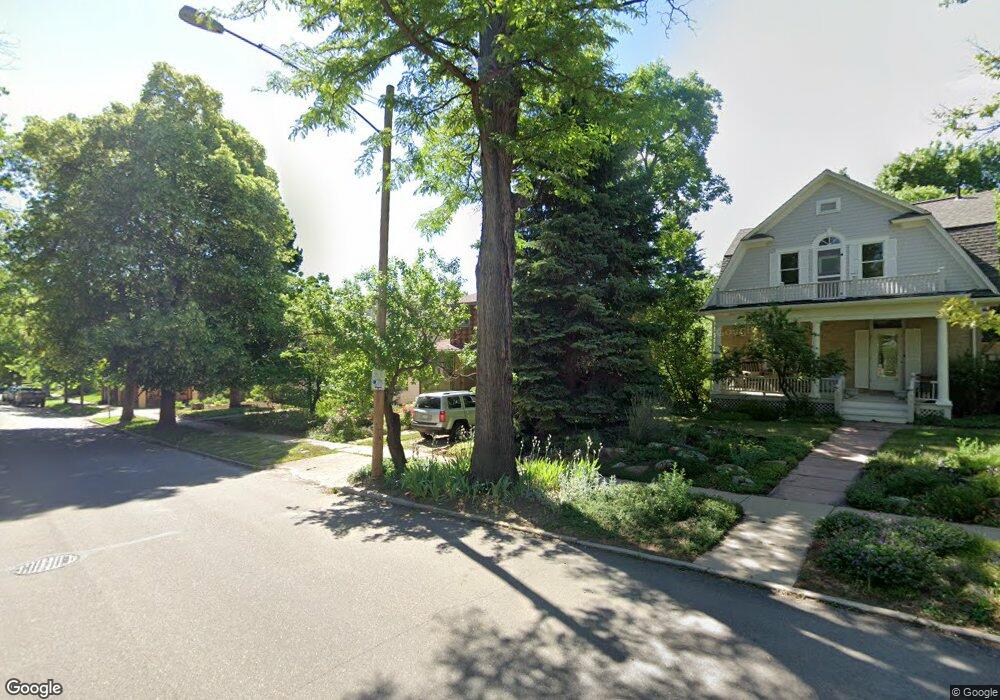
726 Pine St Boulder, CO 80302
Mapleton Hill NeighborhoodEstimated Value: $2,360,081 - $3,143,000
4
Beds
4
Baths
2,191
Sq Ft
$1,240/Sq Ft
Est. Value
About This Home
This home is located at 726 Pine St, Boulder, CO 80302 and is currently estimated at $2,715,770, approximately $1,239 per square foot. 726 Pine St is a home located in Boulder County with nearby schools including Whittier Elementary School, Casey Middle School, and Boulder High School.
Ownership History
Date
Name
Owned For
Owner Type
Purchase Details
Closed on
Oct 1, 2010
Sold by
Segel Leonard
Bought by
Segel Leonard
Current Estimated Value
Home Financials for this Owner
Home Financials are based on the most recent Mortgage that was taken out on this home.
Original Mortgage
$280,000
Outstanding Balance
$185,052
Interest Rate
4.38%
Mortgage Type
New Conventional
Estimated Equity
$2,530,718
Purchase Details
Closed on
Jun 13, 2000
Sold by
Segel Leonard and Segel Rachel
Bought by
Segel Leonard
Purchase Details
Closed on
Nov 26, 1990
Bought by
Segel Leonard and Segel Rachel T
Purchase Details
Closed on
Mar 4, 1987
Bought by
Segel Leonard and Segel Rachel T
Purchase Details
Closed on
Sep 24, 1981
Bought by
Segel Leonard and Segel Rachel T
Create a Home Valuation Report for This Property
The Home Valuation Report is an in-depth analysis detailing your home's value as well as a comparison with similar homes in the area
Home Values in the Area
Average Home Value in this Area
Purchase History
| Date | Buyer | Sale Price | Title Company |
|---|---|---|---|
| Segel Leonard | -- | Fita | |
| Segel Leonard | -- | -- | |
| Segel Leonard | $170,000 | -- | |
| Segel Leonard | $149,500 | -- | |
| Segel Leonard | $124,000 | -- |
Source: Public Records
Mortgage History
| Date | Status | Borrower | Loan Amount |
|---|---|---|---|
| Open | Segel Leonard | $280,000 |
Source: Public Records
Tax History
| Year | Tax Paid | Tax Assessment Tax Assessment Total Assessment is a certain percentage of the fair market value that is determined by local assessors to be the total taxable value of land and additions on the property. | Land | Improvement |
|---|---|---|---|---|
| 2025 | $13,922 | $172,482 | $103,913 | $68,569 |
| 2024 | $13,922 | $172,482 | $103,913 | $68,569 |
| 2023 | $13,681 | $165,115 | $106,517 | $62,283 |
| 2022 | $14,160 | $152,483 | $80,384 | $72,099 |
| 2021 | $13,503 | $156,871 | $82,697 | $74,174 |
| 2020 | $12,284 | $141,120 | $76,577 | $64,543 |
| 2019 | $12,096 | $141,120 | $76,577 | $64,543 |
| 2018 | $11,029 | $127,210 | $69,264 | $57,946 |
| 2017 | $10,684 | $140,637 | $76,575 | $64,062 |
| 2016 | $9,215 | $106,449 | $60,735 | $45,714 |
| 2015 | $8,726 | $86,868 | $34,069 | $52,799 |
| 2014 | $7,304 | $86,868 | $34,069 | $52,799 |
Source: Public Records
Map
Nearby Homes
- 613 Pine St
- 745 Highland Ave
- 620 Pearl St Unit C
- 934 Spruce St
- 545 Pearl St
- 604 Mapleton Ave
- 643 Mapleton Ave
- 854 Walnut St Unit D
- 2033 11th St Unit 3, 1
- 827 Maxwell Ave Unit E
- 2409 5th St
- 715 Arapahoe Ave Unit 2
- 1077 Canyon Blvd Unit 304
- 1077 Canyon Blvd Unit 403
- 1077 Canyon Blvd Unit 305
- 1077 Canyon Blvd Unit 211
- 1111 Maxwell Ave Unit 109
- 1111 Maxwell Ave Unit 105
- 2449 5th St
- 1155 Canyon Blvd Unit 202
Your Personal Tour Guide
Ask me questions while you tour the home.