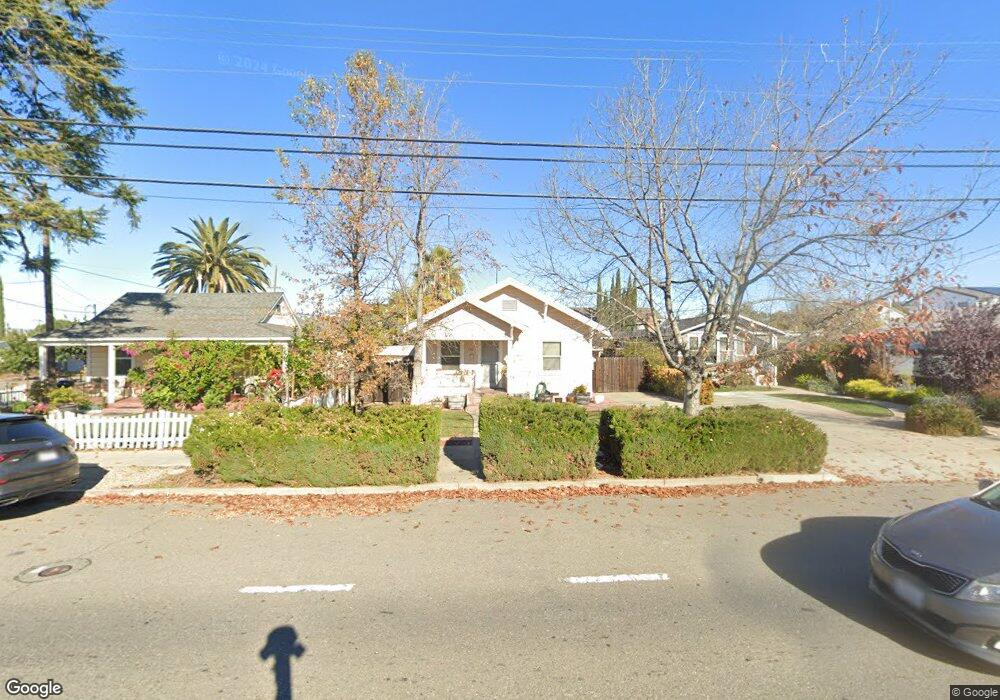
726 S Livermore Ave Livermore, CA 94550
Downtown Livermore NeighborhoodEstimated Value: $736,000 - $930,000
2
Beds
1
Bath
690
Sq Ft
$1,205/Sq Ft
Est. Value
About This Home
This home is located at 726 S Livermore Ave, Livermore, CA 94550 and is currently estimated at $831,118, approximately $1,204 per square foot. 726 S Livermore Ave is a home located in Alameda County with nearby schools including Jackson Avenue Elementary School, East Avenue Middle School, and Livermore High School.
Ownership History
Date
Name
Owned For
Owner Type
Purchase Details
Closed on
Apr 18, 2008
Sold by
Henry Eicher Carol Ann and Henry Jack T
Bought by
Hurley James L
Current Estimated Value
Home Financials for this Owner
Home Financials are based on the most recent Mortgage that was taken out on this home.
Original Mortgage
$315,000
Outstanding Balance
$200,992
Interest Rate
6.11%
Mortgage Type
Purchase Money Mortgage
Estimated Equity
$630,126
Purchase Details
Closed on
Jul 26, 2006
Sold by
Eicher Carol Ann and The Jack T & Carol Ann Eicher
Bought by
Eicher Carol Ann and The Jack T & Carol Ann Eicher
Purchase Details
Closed on
May 17, 2004
Sold by
Henry Jack and Wilcox Alice L
Bought by
Henry Jack T and Eicher Carol Ann
Purchase Details
Closed on
Nov 6, 1998
Sold by
Wilcox Alice L and Wilcox Alice L
Bought by
Henry Jack
Purchase Details
Closed on
Sep 10, 1998
Sold by
Wilcox Jerry K
Bought by
Wilcox Alice L
Create a Home Valuation Report for This Property
The Home Valuation Report is an in-depth analysis detailing your home's value as well as a comparison with similar homes in the area
Home Values in the Area
Average Home Value in this Area
Purchase History
| Date | Buyer | Sale Price | Title Company |
|---|---|---|---|
| Hurley James L | $350,000 | Chicago Title Company | |
| Eicher Carol Ann | -- | None Available | |
| Henry Jack T | -- | -- | |
| Henry Jack | -- | -- | |
| Wilcox Alice L | -- | -- |
Source: Public Records
Mortgage History
| Date | Status | Borrower | Loan Amount |
|---|---|---|---|
| Open | Hurley James L | $315,000 |
Source: Public Records
Tax History Compared to Growth
Tax History
| Year | Tax Paid | Tax Assessment Tax Assessment Total Assessment is a certain percentage of the fair market value that is determined by local assessors to be the total taxable value of land and additions on the property. | Land | Improvement |
|---|---|---|---|---|
| 2025 | $6,183 | $452,700 | $137,910 | $321,790 |
| 2024 | $6,183 | $443,687 | $135,206 | $315,481 |
| 2023 | $6,081 | $441,853 | $132,556 | $309,297 |
| 2022 | $5,984 | $426,191 | $129,957 | $303,234 |
| 2021 | $5,112 | $417,700 | $127,410 | $297,290 |
| 2020 | $5,677 | $420,345 | $126,103 | $294,242 |
| 2019 | $5,693 | $412,107 | $123,632 | $288,475 |
| 2018 | $5,562 | $404,028 | $121,208 | $282,820 |
| 2017 | $5,413 | $396,108 | $118,832 | $277,276 |
| 2016 | $5,202 | $388,341 | $116,502 | $271,839 |
| 2015 | $4,529 | $350,000 | $105,000 | $245,000 |
| 2014 | $4,027 | $305,000 | $91,500 | $213,500 |
Source: Public Records
Map
Nearby Homes
- 3283 East Ave
- 3732 Carrigan Common
- 2211 College Ave
- 1153 Sherry Way
- 2878 4th St Unit 1401
- 3491 Madeira Way
- 2908 Worthing Common
- 1324 Chateau Common Unit 206
- 1909 De Vaca Way
- 1948 Railroad Ave Unit 104
- 161 N L St Unit 101
- 1810 Peary Way
- 1727 2nd St
- 1004 Vienna St
- 1623 4th St
- 3877 Santa Clara Way
- 3370 Gardella Plaza
- 3713 First St
- 3959 Purdue Way
- 2145 Linden St
- 730 S Livermore Ave
- 708 S Livermore Ave
- 2635 7th St
- 740 S Livermore Ave
- 772 S Livermore Ave
- 2569 7th St
- 741 Mcleod St
- 788 S Livermore Ave
- 761 Mcleod St
- 727 Mcleod St
- 713 Mcleod St
- 759 S Livermore Ave
- 742 S G St
- 2518 7th St
- 769 Mcleod St
- 791 Mcleod St
- 691 Mcleod St
- 754 S G St
- 781 S Livermore Ave
- 672 S Livermore Ave