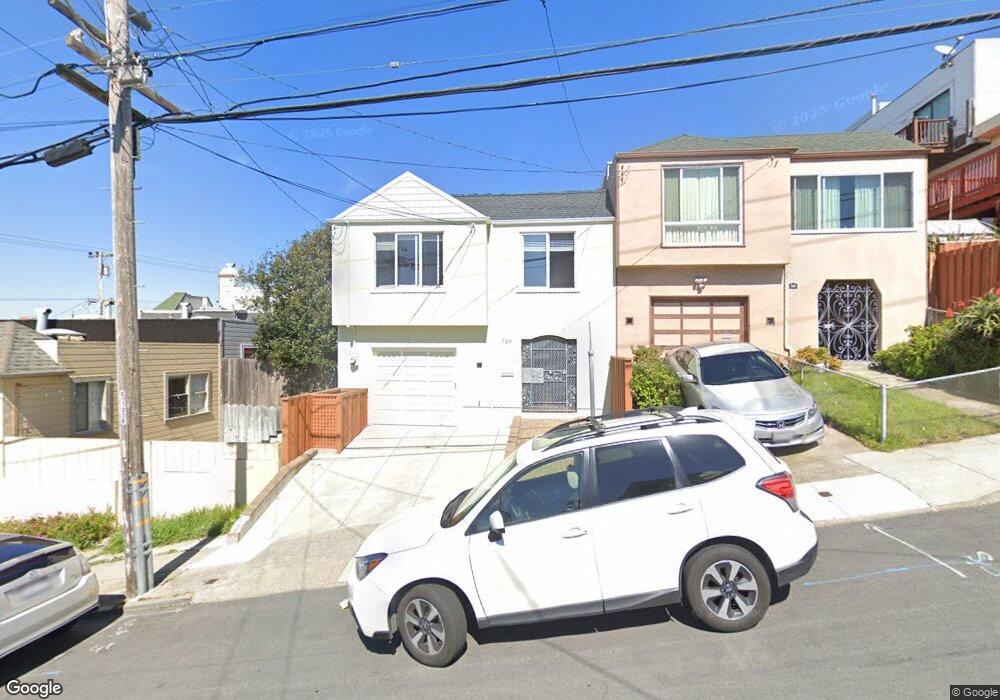
726 Sargent St San Francisco, CA 94132
Ingleside Heights NeighborhoodEstimated Value: $1,077,000 - $1,371,000
3
Beds
2
Baths
1,450
Sq Ft
$817/Sq Ft
Est. Value
About This Home
This home is located at 726 Sargent St, San Francisco, CA 94132 and is currently estimated at $1,184,592, approximately $816 per square foot. 726 Sargent St is a home located in San Francisco County with nearby schools including Ortega (Jose) Elementary School, Aptos Middle School, and Krouzian-Zekarian-Vasbouragan Armenian School.
Ownership History
Date
Name
Owned For
Owner Type
Purchase Details
Closed on
Oct 24, 2022
Sold by
Cheng Jonathan Christian
Bought by
Brown Cheng Family Trust and Cheng
Current Estimated Value
Purchase Details
Closed on
Sep 29, 2011
Sold by
Cheng Patrick Ging Lun and Cheng Christine Yvonne Hule
Bought by
Cheng Jonathan C
Home Financials for this Owner
Home Financials are based on the most recent Mortgage that was taken out on this home.
Original Mortgage
$60,000
Interest Rate
4.15%
Mortgage Type
Unknown
Purchase Details
Closed on
Jan 30, 2007
Sold by
Cheng Patrick Ging Lun and Cheng Christine Yvonne Huie
Bought by
Cheng Patrick Ging Lun and Cheng Christine Yvonne Huie
Purchase Details
Closed on
Apr 22, 2005
Sold by
Cheng Patrick Ging Lun and Cheng Christine Yvonne Huie
Bought by
Cheng Patrick Ging Lun and Cheng Christine Yvonne Huie
Purchase Details
Closed on
Jul 28, 1998
Sold by
Cheng Patrick G L and Cheng Christine Y H
Bought by
Cheng Patrick Ging Lun and Cheng Christine Yvonne Huie
Create a Home Valuation Report for This Property
The Home Valuation Report is an in-depth analysis detailing your home's value as well as a comparison with similar homes in the area
Home Values in the Area
Average Home Value in this Area
Purchase History
| Date | Buyer | Sale Price | Title Company |
|---|---|---|---|
| Brown Cheng Family Trust | -- | None Listed On Document | |
| Cheng Jonathan Christian | -- | None Listed On Document | |
| Cheng Jonathan C | $600,000 | Fidelity National Title Co | |
| Cheng Patrick Ging Lun | -- | None Available | |
| Cheng Patrick Ging Lun | -- | -- | |
| Cheng Patrick Ging Lun | -- | -- |
Source: Public Records
Mortgage History
| Date | Status | Borrower | Loan Amount |
|---|---|---|---|
| Previous Owner | Cheng Jonathan C | $60,000 | |
| Previous Owner | Cheng Jonathan C | $417,000 |
Source: Public Records
Tax History Compared to Growth
Tax History
| Year | Tax Paid | Tax Assessment Tax Assessment Total Assessment is a certain percentage of the fair market value that is determined by local assessors to be the total taxable value of land and additions on the property. | Land | Improvement |
|---|---|---|---|---|
| 2025 | $5,139 | $378,749 | $198,393 | $180,356 |
| 2024 | $5,139 | $371,323 | $194,503 | $176,820 |
| 2023 | $5,053 | $364,043 | $190,690 | $173,353 |
| 2022 | $4,943 | $356,905 | $186,951 | $169,954 |
| 2021 | $4,851 | $349,908 | $183,286 | $166,622 |
| 2020 | $4,891 | $346,321 | $181,407 | $164,914 |
| 2019 | $4,727 | $339,531 | $177,850 | $161,681 |
| 2018 | $4,570 | $332,874 | $174,363 | $158,511 |
| 2017 | $4,136 | $326,348 | $170,945 | $155,403 |
| 2016 | $4,042 | $319,950 | $167,594 | $152,356 |
| 2015 | $3,989 | $315,145 | $165,077 | $150,068 |
| 2014 | $3,884 | $308,973 | $161,844 | $147,129 |
Source: Public Records
Map
Nearby Homes
- 230 Ralston St
- 134 Monticello St
- 621 Shields St
- 501 Sargent St
- 119 Vernon St
- 250 Monticello St
- 451 Ramsell St
- 233 Sargent St
- 475 Head St
- 224 Shields St
- 125 Sargent St
- 73 Summit Way
- 140 Saint Charles Ave
- 20 Sargent St
- 401 Orizaba Ave
- 8400 Oceanview Terrace Unit 305
- 8400 Oceanview Terrace Unit 309
- 8400 Oceanview Terrace Unit 118
- 214 Minerva St
- 299 Sagamore St