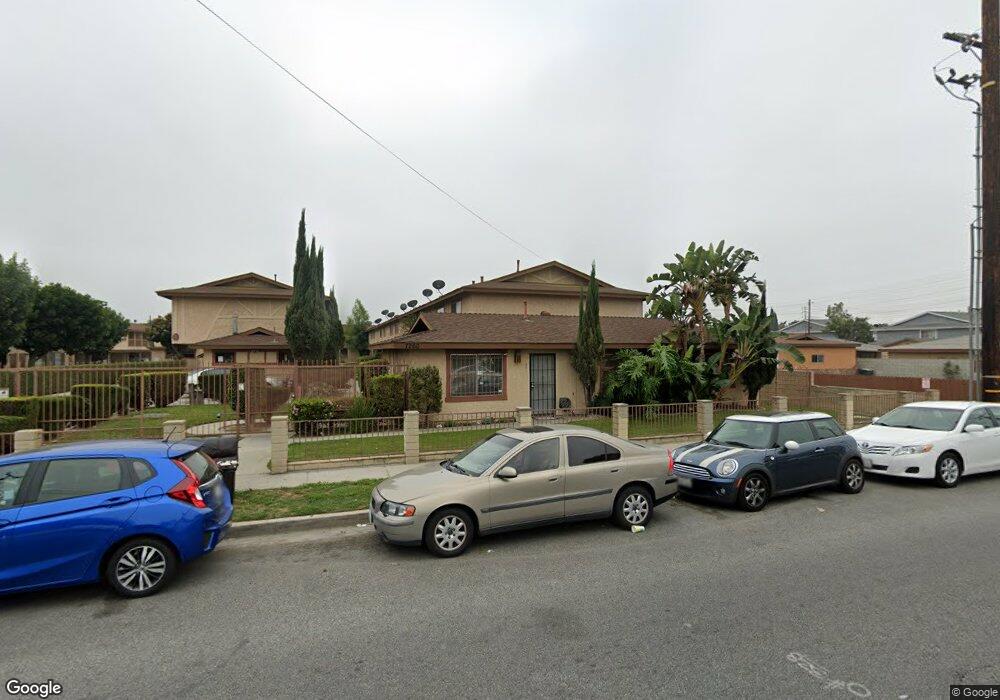
7260 Richfield St Unit 308 Paramount, CA 90723
Estimated Value: $396,000 - $437,000
2
Beds
2
Baths
925
Sq Ft
$450/Sq Ft
Est. Value
About This Home
This home is located at 7260 Richfield St Unit 308, Paramount, CA 90723 and is currently estimated at $416,155, approximately $449 per square foot. 7260 Richfield St Unit 308 is a home located in Los Angeles County with nearby schools including Howard Tanner School, Frank J. Zamboni School, and Paramount High School.
Ownership History
Date
Name
Owned For
Owner Type
Purchase Details
Closed on
Oct 23, 1995
Sold by
Hud
Bought by
Johnson Yolanda Fay
Current Estimated Value
Home Financials for this Owner
Home Financials are based on the most recent Mortgage that was taken out on this home.
Original Mortgage
$75,300
Interest Rate
7.62%
Mortgage Type
FHA
Purchase Details
Closed on
Aug 11, 1995
Sold by
Midfirst Bank
Bought by
Hud
Purchase Details
Closed on
Aug 7, 1995
Sold by
Patterson Karen S and Midfirst Bank
Bought by
Midfirst Bank
Purchase Details
Closed on
Mar 23, 1994
Sold by
Patterson William F and Patterson Leticia Vargas
Bought by
Patterson Karen S
Home Financials for this Owner
Home Financials are based on the most recent Mortgage that was taken out on this home.
Original Mortgage
$69,350
Interest Rate
7.67%
Mortgage Type
FHA
Create a Home Valuation Report for This Property
The Home Valuation Report is an in-depth analysis detailing your home's value as well as a comparison with similar homes in the area
Home Values in the Area
Average Home Value in this Area
Purchase History
| Date | Buyer | Sale Price | Title Company |
|---|---|---|---|
| Johnson Yolanda Fay | $75,500 | California Counties Title Co | |
| Hud | -- | American Title Ins Co | |
| Midfirst Bank | $77,670 | American Title Ins Co | |
| Patterson Karen S | -- | Stewart Title Company |
Source: Public Records
Mortgage History
| Date | Status | Borrower | Loan Amount |
|---|---|---|---|
| Closed | Johnson Yolanda Fay | $75,300 | |
| Previous Owner | Patterson Karen S | $69,350 | |
| Closed | Patterson Karen S | $98,368 |
Source: Public Records
Tax History
| Year | Tax Paid | Tax Assessment Tax Assessment Total Assessment is a certain percentage of the fair market value that is determined by local assessors to be the total taxable value of land and additions on the property. | Land | Improvement |
|---|---|---|---|---|
| 2025 | $1,848 | $125,228 | $16,596 | $108,632 |
| 2024 | $1,848 | $122,773 | $16,271 | $106,502 |
| 2023 | $1,815 | $120,366 | $15,952 | $104,414 |
| 2022 | $1,765 | $118,007 | $15,640 | $102,367 |
| 2021 | $1,723 | $115,694 | $15,334 | $100,360 |
| 2019 | $1,751 | $112,264 | $14,880 | $97,384 |
| 2018 | $1,628 | $110,064 | $14,589 | $95,475 |
| 2016 | $1,465 | $105,791 | $14,023 | $91,768 |
| 2015 | $1,391 | $104,203 | $13,813 | $90,390 |
| 2014 | $1,422 | $102,163 | $13,543 | $88,620 |
Source: Public Records
Map
Nearby Homes
- 14944 Texaco Ave
- 7047 San Marcus St
- 3 Rosecrans Ave
- 7032 Somerset Blvd
- 15137 Gundry Ave Unit F
- 6656 Rosecrans Ave Unit N-10
- 15325 Orange Ave
- 6556 San Vincente St
- 13919 Arthur Ave Unit 22
- 13827 Fairlock Ave
- 15351 Orange Ave Unit 17
- 6542 San Luis St
- 15323 Paramount Blvd
- 14134 Orizaba Ave
- 13636 Garfield Ave
- 12323 Edgebrook Ave
- 8211 Wilbarn St
- 4956 E San Carlos St
- 0 Nevada Ave
- 4949 E San Carlos St
- 7260 Richfield St Unit 303
- 7260 Richfield St Unit 309
- 7260 Richfield St Unit 320
- 7260 Richfield St Unit 319
- 7260 Richfield St Unit 317
- 7260 Richfield St Unit 316
- 7260 Richfield St Unit 315
- 7260 Richfield St Unit 314
- 7260 Richfield St Unit 312
- 7260 Richfield St Unit 311
- 7260 Richfield St Unit 310
- 7260 Richfield St Unit 307
- 7260 Richfield St Unit 306
- 7260 Richfield St Unit 304
- 7260 Richfield St
- 7260 Richfield St Unit 302
- 7260 Richfield St Unit 301
- 7304 Richfield St
- 7303 Exeter St
- 7303 Exeter St Unit 202
Your Personal Tour Guide
Ask me questions while you tour the home.