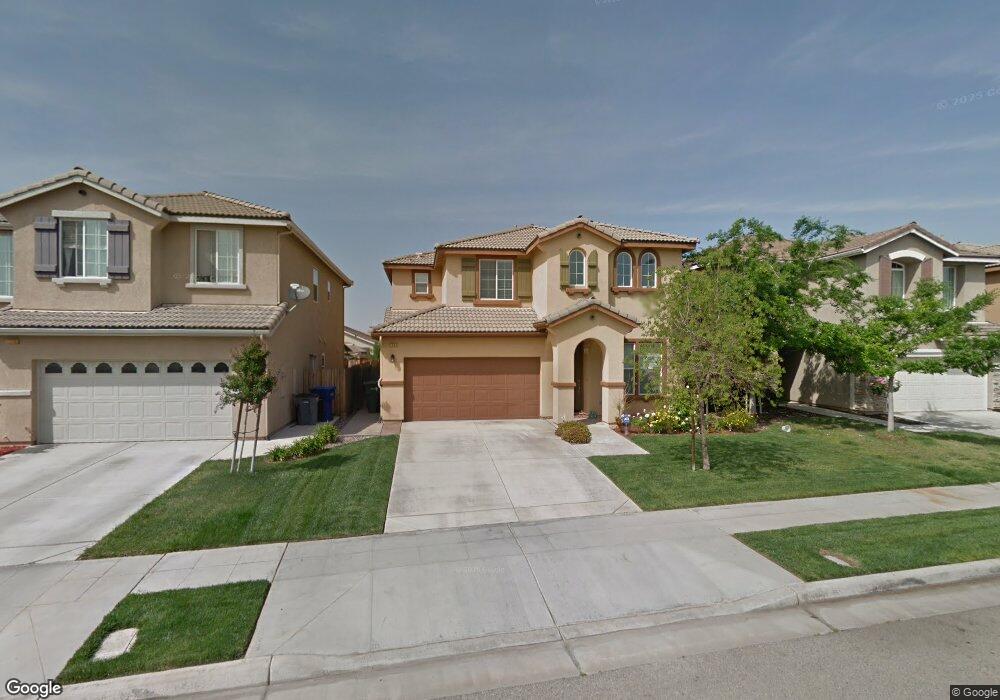
7262 E Cortland Ave Fresno, CA 93737
McLane NeighborhoodEstimated Value: $487,083 - $557,000
4
Beds
3
Baths
2,275
Sq Ft
$225/Sq Ft
Est. Value
About This Home
This home is located at 7262 E Cortland Ave, Fresno, CA 93737 and is currently estimated at $511,521, approximately $224 per square foot. 7262 E Cortland Ave is a home located in Fresno County with nearby schools including Reyburn Intermediate School, Clovis East High School, and Clovis Christian Schools.
Ownership History
Date
Name
Owned For
Owner Type
Purchase Details
Closed on
Jan 25, 2012
Sold by
Yang Ge and Xiong Sher
Bought by
Hundal Tajender S and Kaur Gurpreet
Current Estimated Value
Home Financials for this Owner
Home Financials are based on the most recent Mortgage that was taken out on this home.
Original Mortgage
$197,455
Outstanding Balance
$134,366
Interest Rate
3.75%
Mortgage Type
FHA
Estimated Equity
$377,155
Purchase Details
Closed on
Mar 28, 2008
Sold by
Woodside Saratoga Sales Inc
Bought by
Yang Ge and Xiong Sher
Home Financials for this Owner
Home Financials are based on the most recent Mortgage that was taken out on this home.
Original Mortgage
$285,027
Interest Rate
6.04%
Mortgage Type
FHA
Create a Home Valuation Report for This Property
The Home Valuation Report is an in-depth analysis detailing your home's value as well as a comparison with similar homes in the area
Home Values in the Area
Average Home Value in this Area
Purchase History
| Date | Buyer | Sale Price | Title Company |
|---|---|---|---|
| Hundal Tajender S | $205,000 | Chicago Title Company | |
| Yang Ge | $289,500 | First American Title Company |
Source: Public Records
Mortgage History
| Date | Status | Borrower | Loan Amount |
|---|---|---|---|
| Open | Hundal Tajender S | $197,455 | |
| Previous Owner | Yang Ge | $285,027 |
Source: Public Records
Tax History Compared to Growth
Tax History
| Year | Tax Paid | Tax Assessment Tax Assessment Total Assessment is a certain percentage of the fair market value that is determined by local assessors to be the total taxable value of land and additions on the property. | Land | Improvement |
|---|---|---|---|---|
| 2025 | $3,230 | $257,480 | $75,357 | $182,123 |
| 2023 | $3,084 | $247,483 | $72,432 | $175,051 |
| 2022 | $3,031 | $242,631 | $71,012 | $171,619 |
| 2021 | $2,946 | $237,874 | $69,620 | $168,254 |
| 2020 | $2,902 | $235,436 | $68,907 | $166,529 |
| 2019 | $2,849 | $230,820 | $67,556 | $163,264 |
| 2018 | $2,804 | $226,295 | $66,232 | $160,063 |
| 2017 | $2,747 | $221,859 | $64,934 | $156,925 |
| 2016 | $2,658 | $217,510 | $63,661 | $153,849 |
| 2015 | $2,672 | $214,244 | $62,705 | $151,539 |
| 2014 | $2,779 | $210,048 | $61,477 | $148,571 |
Source: Public Records
Map
Nearby Homes
- 7269 E Cortland Ave
- 3083 N Stanley Ave
- 7369 E Garland Ave
- 7128 E Simpson Ave
- 7458 E Robinson Ave
- 7330 E Princeton Ave
- 2819 N Redda Rd
- 2872 N Locan Ave
- 3452 N Triad Ave
- 2735 N Redda Rd
- 3514 Hornet Ave
- 2676 N Janice Ave
- 7063 E Brown Ave
- 3342 N Carriage Ave
- 3329 N Shelly Ave
- 3062 N Filbert Ave
- 2860 N Locan Ave
- 2844 N Vahe Ave
- 3278 Magnolia Ave
- 2302 N Jason Ave
- 7274 E Cortland Ave
- 7250 E Cortland Ave
- 7274 E Cortland; #1362
- 7238 E Cortland Ave
- 7286 E Cortland Ave
- 7259 E Dayton Ave
- 7247 E Dayton Ave
- 7271 E Dayton Ave
- 7235 E Dayton Ave
- 7226 E Cortland Ave
- 7290 E Cortland Ave
- 7283 E Dayton # 1350
- 7283 E Dayton Ave
- 7223 E Dayton Ave
- 7257 E Cortland Ave
- 7281 E Cortland Ave
- 7214 E Cortland Ave
- 7302 E Cortland Ave
- 7245 E Cortland Ave
- 7302 E Cortland Ave; # 1359