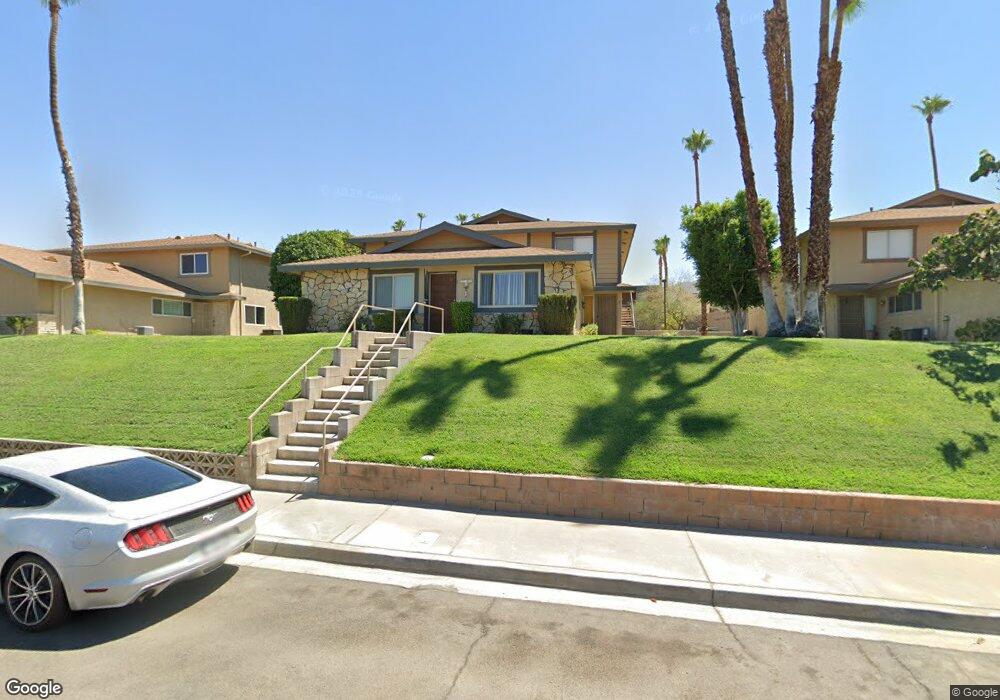
72657 Thrush Rd Unit 2 Palm Desert, CA 92260
Estimated Value: $238,588 - $267,000
2
Beds
1
Bath
840
Sq Ft
$307/Sq Ft
Est. Value
About This Home
This home is located at 72657 Thrush Rd Unit 2, Palm Desert, CA 92260 and is currently estimated at $257,647, approximately $306 per square foot. 72657 Thrush Rd Unit 2 is a home located in Riverside County with nearby schools including La Quinta Middle School, Palm Desert High School, and George Washington Charter School.
Ownership History
Date
Name
Owned For
Owner Type
Purchase Details
Closed on
Mar 24, 2021
Sold by
Robbins Karen A and The Robbins Family Trust
Bought by
Obrien Brandon and Meraki Ventures Llc
Current Estimated Value
Purchase Details
Closed on
Feb 23, 2013
Sold by
Robbins Karen A
Bought by
Robbins Karen A
Purchase Details
Closed on
May 9, 2008
Sold by
Robbins Verill and Robbins Esther J
Bought by
Robbins Steven B and Robbins Karen A
Home Financials for this Owner
Home Financials are based on the most recent Mortgage that was taken out on this home.
Original Mortgage
$61,180
Interest Rate
5.88%
Mortgage Type
Stand Alone Refi Refinance Of Original Loan
Purchase Details
Closed on
Mar 19, 1996
Sold by
Robbins Verill and Robbins Esther J
Bought by
Robbins Verill and Robbins Esther J
Create a Home Valuation Report for This Property
The Home Valuation Report is an in-depth analysis detailing your home's value as well as a comparison with similar homes in the area
Purchase History
We collect this data history from publicly available records. To have your information removed, we recommend requesting removal directly through your county’s website.
| Date | Buyer | Sale Price | Title Company |
|---|---|---|---|
| Obrien Brandon | $60,000 | Wfg Title Company Of Ca | |
| Robbins Karen A | -- | None Available | |
| Robbins Steven B | -- | Orange Coast Title Company | |
| Robbins Verill | -- | -- |
Source: Public Records
Mortgage History
We collect this data history from publicly available records. To have your information removed, we recommend requesting removal directly through your county’s website.
| Date | Status | Borrower | Loan Amount |
|---|---|---|---|
| Previous Owner | Robbins Steven B | $61,180 |
Source: Public Records
Tax History
| Year | Tax Paid | Tax Assessment Tax Assessment Total Assessment is a certain percentage of the fair market value that is determined by local assessors to be the total taxable value of land and additions on the property. | Land | Improvement |
|---|---|---|---|---|
| 2025 | $2,596 | $178,598 | $45,460 | $133,138 |
| 2023 | $2,596 | $171,665 | $43,696 | $127,969 |
| 2022 | $2,457 | $168,300 | $42,840 | $125,460 |
| 2021 | $1,307 | $76,240 | $31,187 | $45,053 |
| 2020 | $1,289 | $75,460 | $30,868 | $44,592 |
| 2019 | $1,271 | $73,981 | $30,263 | $43,718 |
| 2018 | $1,253 | $72,531 | $29,670 | $42,861 |
| 2017 | $1,233 | $71,110 | $29,089 | $42,021 |
| 2016 | $1,210 | $69,717 | $28,519 | $41,198 |
| 2015 | $1,212 | $68,672 | $28,092 | $40,580 |
| 2014 | $1,197 | $67,329 | $27,543 | $39,786 |
Source: Public Records
Map
Nearby Homes
- 72631 Thrush Rd Unit 2
- 72532 Edgehill Dr Unit 2
- 72694 Eagle Rd Unit 3
- 72725 Jack Kramer Ln
- 72844 Tony Trabert Ln
- 72847 Don Larson Ln
- 72714 Willow St Unit 4
- 72853 Don Larson Ln
- 72856 Roy Emerson Ln
- 72957 Arthur Ashe Ln
- 72954 Ken Rosewall Ln
- 72950 Amber St
- 133 Vista Royale
- 72795 Somera Rd
- 72935 Deer Grass Dr
- 72817 Skyward Way
- 73062 Helen Moody Ln
- 46310 Shadow Mountain Dr
- 73068 Helen Moody Ln
- 73103 Alice Marble Ln
- 72630 Thrush Rd Unit 1
- 72630 Thrush Rd Unit 4
- 72630 Thrush Rd Unit 3
- 72630 Thrush Rd Unit 2
- 72642 Thrush Rd Unit 4
- 72642 Thrush Rd Unit 3
- 72642 Thrush Rd Unit 2
- 72642 Thrush Rd Unit 1
- 72631 Thrush Rd Unit 4
- 72631 Thrush Rd Unit 3
- 72631 Thrush Rd Unit 1
- 72619 Thrush Rd Unit 1
- 72619 Thrush Rd Unit 4
- 72619 Thrush Rd Unit 3
- 72619 Thrush Rd Unit 2
- 72502 Edgehill Dr
- 72502 Edgehill Dr Unit 4
- 72502 Edgehill Dr Unit 3
- 72502 Edgehill Dr Unit 2
- 72502 Edgehill Dr Unit 1
Your Personal Tour Guide
Ask me questions while you tour the home.