727 E Clay St Stockton, CA 95206
Seaport NeighborhoodEstimated Value: $322,000 - $437,000
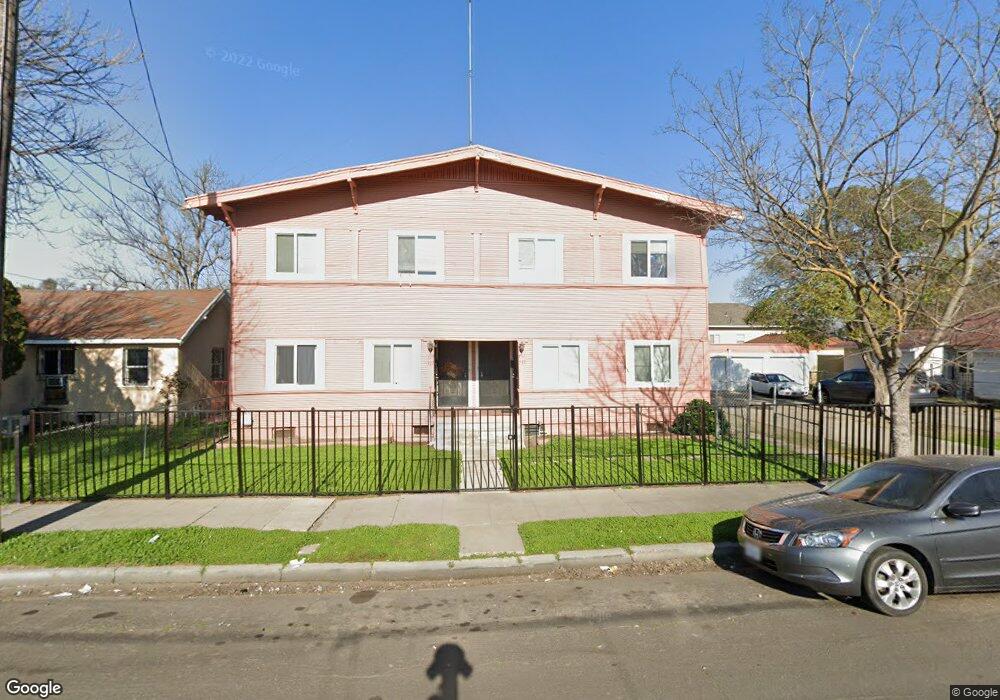
About This Home
This home is located at 727 E Clay St, Stockton, CA 95206 and is currently estimated at $369,000, approximately $119 per square foot. 727 E Clay St is a home located in San Joaquin County with nearby schools including Spanos (Alex G.) Elementary School, Dolores Huerta Elementary School, and Hazelton Elementary School.
Ownership History
We collect this data history from publicly available records. To have your information removed, we recommend requesting removal directly through your county’s website.
Purchase Details
Home Financials for this Owner
Home Financials are based on the most recent Mortgage that was taken out on this home.Purchase Details
Purchase Details
Home Financials for this Owner
Home Financials are based on the most recent Mortgage that was taken out on this home.Purchase Details
Home Financials for this Owner
Home Financials are based on the most recent Mortgage that was taken out on this home.Purchase Details
Purchase Details
Home Financials for this Owner
Home Financials are based on the most recent Mortgage that was taken out on this home.Purchase Details
Home Financials for this Owner
Home Financials are based on the most recent Mortgage that was taken out on this home.Purchase Details
Home Financials for this Owner
Home Financials are based on the most recent Mortgage that was taken out on this home.Purchase Details
Home Financials for this Owner
Home Financials are based on the most recent Mortgage that was taken out on this home.Home Values in the Area
Average Home Value in this Area
Purchase History
We collect this data history from publicly available records. To have your information removed, we recommend requesting removal directly through your county’s website.
| Date | Buyer | Sale Price | Title Company |
|---|---|---|---|
| $260,000 | North American Title Co Inc | ||
| -- | None Available | ||
| $76,000 | Fidelity National Title Co | ||
| -- | Alliance Title Co | ||
| $270,000 | Fidelity Natl Title Ins Co | ||
| $240,000 | Alliance Title Co | ||
| -- | -- | ||
| -- | Chicago Title Co | ||
| $80,000 | Chicago Title Co |
Mortgage History
We collect this data history from publicly available records. To have your information removed, we recommend requesting removal directly through your county’s website.
| Date | Status | Borrower | Loan Amount |
|---|---|---|---|
| Open | $255,290 | ||
| Previous Owner | $53,000 | ||
| Previous Owner | $344,000 | ||
| Previous Owner | $216,000 | ||
| Previous Owner | $55,000 |
Tax History
We collect this data history from publicly available records. To have your information removed, we recommend requesting removal directly through your county’s website.
| Year | Tax Paid | Tax Assessment Tax Assessment Total Assessment is a certain percentage of the fair market value that is determined by local assessors to be the total taxable value of land and additions on the property. | Land | Improvement |
|---|---|---|---|---|
| 2025 | $3,955 | $312,473 | $90,134 | $222,339 |
| 2024 | $3,892 | $306,347 | $88,367 | $217,980 |
| 2023 | $3,806 | $300,341 | $86,635 | $213,706 |
| 2022 | $3,713 | $294,453 | $84,937 | $209,516 |
| 2021 | $3,568 | $288,680 | $83,272 | $205,408 |
| 2020 | $3,637 | $285,721 | $82,419 | $203,302 |
| 2019 | $3,623 | $280,119 | $80,803 | $199,316 |
| 2018 | $3,556 | $274,627 | $79,219 | $195,408 |
| 2017 | $3,370 | $269,243 | $77,666 | $191,577 |
| 2016 | $3,431 | $263,965 | $76,144 | $187,821 |
| 2014 | $1,676 | $128,581 | $35,159 | $93,422 |
Map
- 705 E Anderson St
- 526 E Jackson St
- 544 E Clay St
- 446 E Anderson St
- 1121 E Clay St
- 340 E Jefferson St
- 1428 S Sutter St
- 323 E 1st St
- 835 S Airport Way
- 1516 S Hunter St
- 1761 Sikh Temple St
- 1601 S San Joaquin St
- 1749 S American St
- 518 S Sutter St
- 1345 E Scotts Ave
- 432 E Sonora St
- 18 W Jefferson St
- 416 E Sonora St
- 328 S Sutter St
- 732 S El Dorado St
- 1135 S Grant St
- 1127 S Grant St
- 721 E Jackson St
- 736 E Jackson St
- 1205 S Grant St
- 732 E Jackson St
- 1121 S Grant St
- 1148 S Grant St
- 724 E Jackson St
- 1138 S Grant St
- 718 E Jackson St
- 705 E Jackson St
- 1219 S Grant St
- 802 E Jackson St
- 1128 S Grant St
- 726 E Jefferson St
- 712 E Jackson St
- 825 E Jackson St
- 1117 S Grant St
- 704 E Jackson St
Ask me questions while you tour the home.