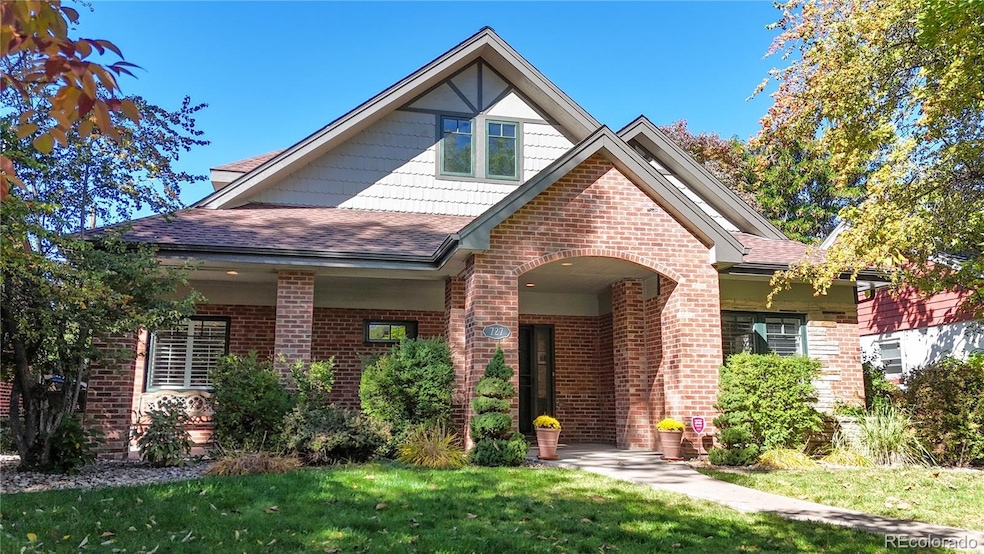
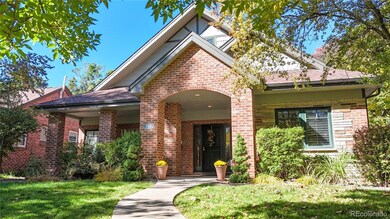

727 Fairfax St Denver, CO 80220
Hale NeighborhoodEstimated payment $7,380/month
Highlights
- No HOA
- Fireplace
- Evaporated cooling system
- Carson Elementary School Rated A-
- Forced Air Heating System
- Level Lot
About This Home
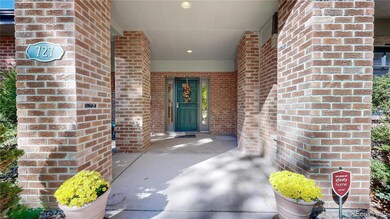
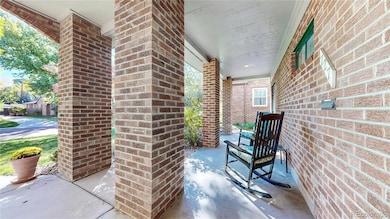
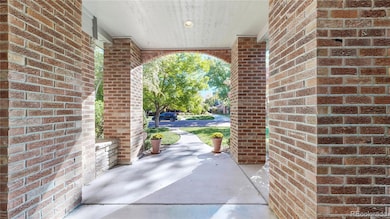
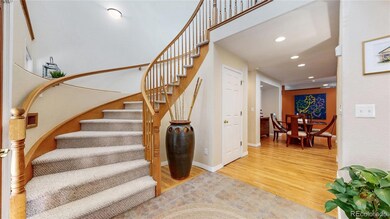
Welcome to 727 Fairfax Street, a beautifully updated 4-bedroom, 4-bathroom home nestled in the heart of Denver’s highly sought-after Mayfair neighborhood. This classic residence blends historic character with thoughtful modern upgrades, offering a perfect balance of comfort, style, and convenience. Step inside to discover a light-filled, open-concept main level featuring hardwood floors, generous windows, and a seamless layout that invites both relaxation and entertainment. The double-sided fireplace adds warmth and charm to the spacious living room and adjoining dining area, ideal for everything from cozy evenings to lively dinner parties. The updated kitchen is both stylish and functional, boasting oak cabinetry, granite countertops, black appliances, and plenty of prep space for the home chef. Upstairs, the primary suite serves as a peaceful retreat, featuring a walk-in closet and a private en-suite bath. Two additional bedrooms on the main level share a well-appointed full bathroom. Downstairs, the finished basement offers flexible living space, perfect for a family room, home office, gym, or guest suite, along with an additional bathroom for added convenience. Outside, enjoy a landscaped backyard with mature trees, a patio for entertaining, and a detached garage providing extra storage and parking. Located blocks from the vibrant 9th & Colorado redevelopment, you’ll have easy access to a movie theater, shops, restaurants, and more. Plus, you’re minutes from Mayfair Park, City Park, Denver Zoo, and the Museum of Nature & Science. With Cherry Creek and downtown Denver just a short drive away, this home offers the best of city living in a welcoming neighborhood setting. Don’t miss this rare opportunity to own a timeless home in one of Denver’s most desirable communities.
Listing Agent
Brokers Guild Homes Brokerage Email: laneteamdenver@gmail.com,303-549-7212 License #100002572 Listed on: 10/08/2025

Home Details
Home Type
- Single Family
Est. Annual Taxes
- $6,746
Year Built
- Built in 1951
Lot Details
- 5,850 Sq Ft Lot
- Level Lot
- Property is zoned E-SU-DX
Parking
- 2 Car Garage
Home Design
- Frame Construction
Interior Spaces
- 2-Story Property
- Fireplace
Kitchen
- Oven
- Range
- Microwave
- Dishwasher
Bedrooms and Bathrooms
Laundry
- Dryer
- Washer
Finished Basement
- Basement Fills Entire Space Under The House
- Crawl Space
Schools
- Carson Elementary School
- Hill Middle School
- George Washington High School
Utilities
- Evaporated cooling system
- Forced Air Heating System
- Heating System Uses Natural Gas
Community Details
- No Home Owners Association
- Porter And Raymonds Montclair Subdivision
Listing and Financial Details
- Exclusions: Seller's personal property
- Assessor Parcel Number 6064-28-030
Map
Home Values in the Area
Average Home Value in this Area
Tax History
| Year | Tax Paid | Tax Assessment Tax Assessment Total Assessment is a certain percentage of the fair market value that is determined by local assessors to be the total taxable value of land and additions on the property. | Land | Improvement |
|---|---|---|---|---|
| 2024 | $6,746 | $85,170 | $35,300 | $49,870 |
| 2023 | $6,600 | $85,170 | $35,300 | $49,870 |
| 2022 | $5,331 | $67,030 | $22,240 | $44,790 |
| 2021 | $5,145 | $68,950 | $22,880 | $46,070 |
| 2020 | $5,095 | $68,670 | $22,880 | $45,790 |
| 2019 | $4,952 | $68,670 | $22,880 | $45,790 |
| 2018 | $4,787 | $61,880 | $20,950 | $40,930 |
| 2017 | $4,773 | $61,880 | $20,950 | $40,930 |
| 2016 | $4,758 | $58,350 | $22,001 | $36,349 |
| 2015 | $4,559 | $67,600 | $22,001 | $45,599 |
| 2014 | $4,031 | $48,540 | $17,369 | $31,171 |
Property History
| Date | Event | Price | List to Sale | Price per Sq Ft |
|---|---|---|---|---|
| 11/11/2025 11/11/25 | Pending | -- | -- | -- |
| 10/08/2025 10/08/25 | For Sale | $1,300,000 | -- | $371 / Sq Ft |
Purchase History
| Date | Type | Sale Price | Title Company |
|---|---|---|---|
| Warranty Deed | $592,000 | Guardian Title | |
| Interfamily Deed Transfer | -- | -- |
Mortgage History
| Date | Status | Loan Amount | Loan Type |
|---|---|---|---|
| Open | $473,600 | Purchase Money Mortgage | |
| Previous Owner | $154,400 | No Value Available | |
| Closed | $59,140 | No Value Available |
Source: REcolorado®
MLS Number: 2936402
APN: 6064-28-030
Disclaimer: Certain information contained herein is derived from information provided by parties other than Homes.com. All information provided is deemed reliable, but is not guaranteed to be accurate and should be independently verified.
![]() The content relating to real estate for sale in this Web site comes in part from the Internet Data eXchange (“IDX”) program of METROLIST, INC., DBA RECOLORADO®. Real estate listings held by brokers other than Ten-X are marked with the IDX Logo. This information is being provided for the consumers’ personal, non-commercial use and may not be used for any other purpose. All information subject to change and should be independently verified.
The content relating to real estate for sale in this Web site comes in part from the Internet Data eXchange (“IDX”) program of METROLIST, INC., DBA RECOLORADO®. Real estate listings held by brokers other than Ten-X are marked with the IDX Logo. This information is being provided for the consumers’ personal, non-commercial use and may not be used for any other purpose. All information subject to change and should be independently verified.
This publication is designed to provide information with regard to the subject matter covered. It is displayed with the understanding that the publisher and authors are not engaged in rendering real estate, legal, accounting, tax, or other professional services and that the publisher and authors are not offering such advice in this publication. If real estate, legal, or other expert assistance is required, the services of a competent, professional person should be sought.
The information contained in this publication is subject to change without notice. METROLIST, INC., DBA RECOLORADO MAKES NO WARRANTY OF ANY KIND WITH REGARD TO THIS MATERIAL, INCLUDING, BUT NOT LIMITED TO, THE IMPLIED WARRANTIES OF MERCHANTABILITY AND FITNESS FOR A PARTICULAR PURPOSE. METROLIST, INC., DBA RECOLORADO SHALL NOT BE LIABLE FOR ERRORS CONTAINED HEREIN OR FOR ANY DAMAGES IN CONNECTION WITH THE FURNISHING, PERFORMANCE, OR USE OF THIS MATERIAL.
PUBLISHER’S NOTICE: All real estate advertised herein is subject to the Federal Fair Housing Act and the Colorado Fair Housing Act, which Acts make it illegal to make or publish any advertisement that indicates any preference, limitation, or discrimination based on race, color, religion, sex, handicap, familial status, or national origin.
METROLIST, INC., DBA RECOLORADO will not knowingly accept any advertising for real estate that is in violation of the law. All persons are hereby informed that all dwellings advertised are available on an equal opportunity basis.
© 2025 METROLIST, INC., DBA RECOLORADO® – All Rights Reserved. 6455 S. Yosemite St., Suite 500 Greenwood Village, CO 80111 USA
ALL RIGHTS RESERVED WORLDWIDE. No part of this publication may be reproduced, adapted, translated, stored in a retrieval system or transmitted in any form or by any means, electronic, mechanical, photocopying, recording, or otherwise, without the prior written permission of the publisher. The information contained herein including but not limited to all text, photographs, digital images, virtual tours, may be seeded and monitored for protection and tracking.
- 636 Fairfax St
- 1421 N Fairfax St
- 799 Dahlia St Unit 201
- 4824 E 6th Avenue Pkwy
- 832 Dahlia St
- 785 Dexter St
- 836 Dexter St Unit 205
- 628 Cherry St
- 4801 E 9th Ave Unit 209S
- 4801 E 9th Ave Unit 207S
- 955 Eudora St Unit 204E
- 955 Eudora St Unit 1601
- 955 Eudora St Unit 1107E
- 955 Eudora St Unit 1106
- 766 Holly St
- 451 Hudson St
- 424 Grape St
- 5530 E 6th Avenue Pkwy
- 4800 Hale Pkwy Unit 206N
- 444 Cherry St