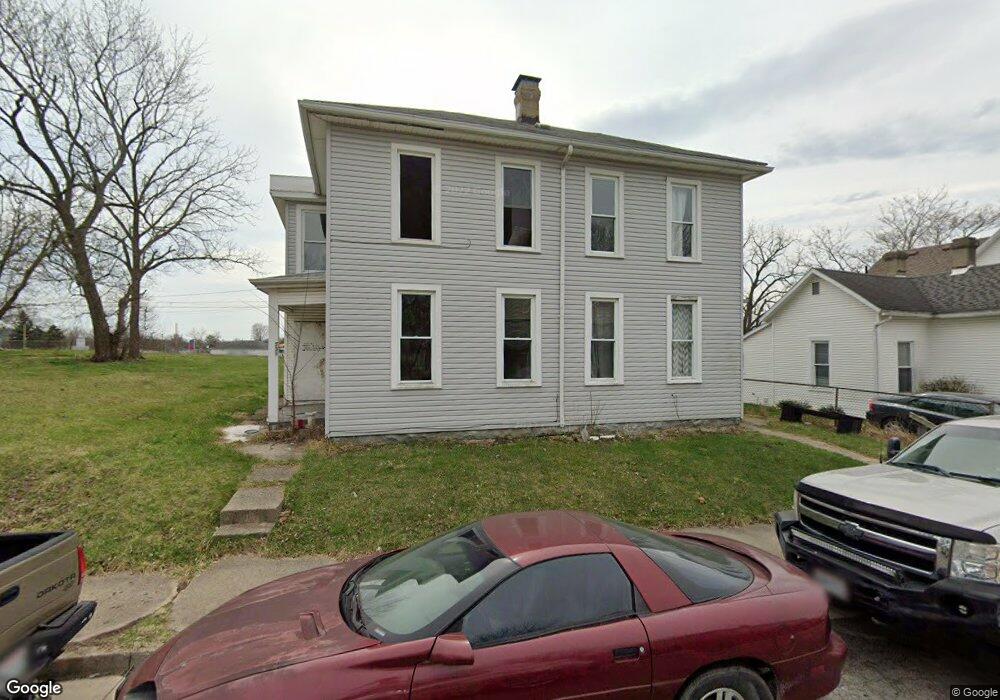
727 Summer St Unit 731 Springfield, OH 45505
Estimated Value: $63,000 - $131,000
4
Beds
2
Baths
2,304
Sq Ft
$38/Sq Ft
Est. Value
About This Home
This home is located at 727 Summer St Unit 731, Springfield, OH 45505 and is currently estimated at $86,995, approximately $37 per square foot. 727 Summer St Unit 731 is a home located in Clark County with nearby schools including Kenwood Elementary School, Hayward Middle School, and Springfield High School.
Ownership History
Date
Name
Owned For
Owner Type
Purchase Details
Closed on
Sep 16, 2022
Sold by
W & W Rentals Ii
Bought by
Orr Carlyne
Current Estimated Value
Purchase Details
Closed on
Oct 1, 2018
Bought by
W & Rental Ii
Purchase Details
Closed on
Nov 5, 2008
Sold by
Lyons Paul B and Lyons Barbara J
Bought by
Thomas Jason A and Thomas Lyndzi S
Home Financials for this Owner
Home Financials are based on the most recent Mortgage that was taken out on this home.
Original Mortgage
$152,972
Interest Rate
6.09%
Mortgage Type
Seller Take Back
Purchase Details
Closed on
Dec 22, 2003
Sold by
Pontsler Charles E
Bought by
Lyons Paul B and Lyons Barbara J
Purchase Details
Closed on
Dec 18, 1991
Create a Home Valuation Report for This Property
The Home Valuation Report is an in-depth analysis detailing your home's value as well as a comparison with similar homes in the area
Home Values in the Area
Average Home Value in this Area
Purchase History
| Date | Buyer | Sale Price | Title Company |
|---|---|---|---|
| Orr Carlyne | $40,000 | Ohio Real Estate Title | |
| Orr Carlyne | $40,000 | Ohio Real Estate Title | |
| W & Rental Ii | -- | -- | |
| Thomas Jason A | $163,900 | Attorney | |
| Lyons Paul B | $49,000 | -- | |
| -- | $14,500 | -- |
Source: Public Records
Mortgage History
| Date | Status | Borrower | Loan Amount |
|---|---|---|---|
| Previous Owner | Thomas Jason A | $152,972 |
Source: Public Records
Tax History
| Year | Tax Paid | Tax Assessment Tax Assessment Total Assessment is a certain percentage of the fair market value that is determined by local assessors to be the total taxable value of land and additions on the property. | Land | Improvement |
|---|---|---|---|---|
| 2025 | $218 | $28,140 | $1,980 | $26,160 |
| 2024 | $212 | $4,300 | $1,670 | $2,630 |
| 2023 | $212 | $4,300 | $1,670 | $2,630 |
| 2022 | $218 | $4,300 | $1,670 | $2,630 |
| 2021 | $204 | $3,710 | $1,420 | $2,290 |
| 2020 | $204 | $3,710 | $1,420 | $2,290 |
| 2019 | $205 | $3,710 | $1,420 | $2,290 |
| 2018 | $197 | $3,430 | $1,420 | $2,010 |
| 2017 | $216 | $3,431 | $1,418 | $2,013 |
| 2016 | $267 | $3,431 | $1,418 | $2,013 |
| 2015 | $12,901 | $13,241 | $1,418 | $11,823 |
| 2014 | $774 | $13,241 | $1,418 | $11,823 |
| 2013 | $8,773 | $13,241 | $1,418 | $11,823 |
Source: Public Records
Map
Nearby Homes
- 705 York St
- 625 Tibbetts Ave
- 1008 Tibbetts Ave
- 453 E Pleasant St
- 441 E Euclid Ave
- 652 E Southern Ave
- 418 Linden Ave
- 638 Clifton Ave
- 1111 Lafayette Ave
- 908 Pine St
- 1318 Maryland Ave
- 550 E Rose St
- 205 E Grand Ave
- 1247 Selma Rd
- 1215 E High St
- 1213 Gable St
- 360 S Greenmount Ave
- 907-913 S Limestone St
- 411 S Limestone St
- 1519 Tibbetts Ave
Your Personal Tour Guide
Ask me questions while you tour the home.