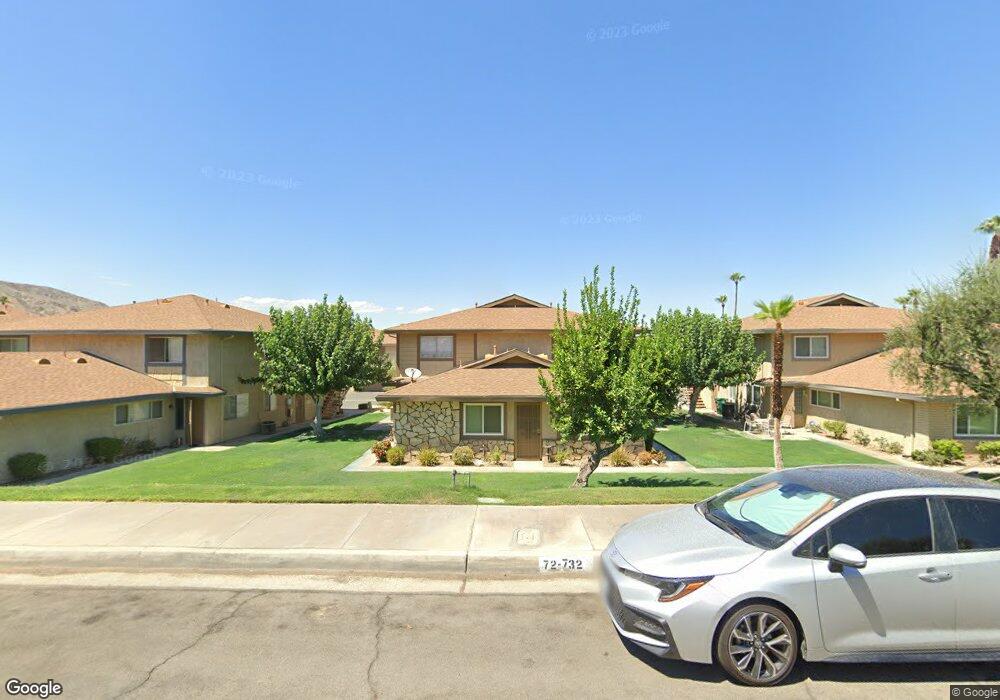
72732 Bursera Way Unit 2 Palm Desert, CA 92260
Estimated Value: $242,175 - $270,000
2
Beds
1
Bath
840
Sq Ft
$309/Sq Ft
Est. Value
About This Home
This home is located at 72732 Bursera Way Unit 2, Palm Desert, CA 92260 and is currently estimated at $259,294, approximately $308 per square foot. 72732 Bursera Way Unit 2 is a home located in Riverside County with nearby schools including La Quinta Middle School, Palm Desert High School, and George Washington Charter School.
Ownership History
Date
Name
Owned For
Owner Type
Purchase Details
Closed on
Aug 11, 2005
Sold by
Oliva Anavela
Bought by
Rohlfs Gary J and Giella Kenneth F
Current Estimated Value
Home Financials for this Owner
Home Financials are based on the most recent Mortgage that was taken out on this home.
Original Mortgage
$119,500
Interest Rate
5.75%
Mortgage Type
Purchase Money Mortgage
Purchase Details
Closed on
Sep 19, 2003
Sold by
Oliva Anavela and Sagastume Anavela
Bought by
Oliva Anavela
Home Financials for this Owner
Home Financials are based on the most recent Mortgage that was taken out on this home.
Original Mortgage
$70,000
Interest Rate
6.17%
Mortgage Type
Purchase Money Mortgage
Purchase Details
Closed on
Sep 12, 2000
Sold by
Sagastume Carlos E
Bought by
Sagastume Anavela
Purchase Details
Closed on
Jan 29, 1996
Sold by
Sagastume Carlos E and Sagastume Anavela
Bought by
Sagastume Carlos E
Create a Home Valuation Report for This Property
The Home Valuation Report is an in-depth analysis detailing your home's value as well as a comparison with similar homes in the area
Home Values in the Area
Average Home Value in this Area
Purchase History
| Date | Buyer | Sale Price | Title Company |
|---|---|---|---|
| Rohlfs Gary J | $180,000 | Southland Title Inland Empir | |
| Oliva Anavela | -- | Chicago Title Co | |
| Sagastume Anavela | -- | -- | |
| Sagastume Carlos E | -- | -- |
Source: Public Records
Mortgage History
| Date | Status | Borrower | Loan Amount |
|---|---|---|---|
| Previous Owner | Rohlfs Gary J | $119,500 | |
| Previous Owner | Oliva Anavela | $70,000 |
Source: Public Records
Tax History Compared to Growth
Tax History
| Year | Tax Paid | Tax Assessment Tax Assessment Total Assessment is a certain percentage of the fair market value that is determined by local assessors to be the total taxable value of land and additions on the property. | Land | Improvement |
|---|---|---|---|---|
| 2025 | $1,589 | $94,696 | $29,591 | $65,105 |
| 2023 | $1,589 | $91,021 | $28,443 | $62,578 |
| 2022 | $1,489 | $89,237 | $27,886 | $61,351 |
| 2021 | $1,445 | $87,489 | $27,340 | $60,149 |
| 2020 | $1,424 | $86,593 | $27,060 | $59,533 |
| 2019 | $1,403 | $84,896 | $26,530 | $58,366 |
| 2018 | $1,383 | $83,232 | $26,010 | $57,222 |
| 2017 | $1,360 | $81,600 | $25,500 | $56,100 |
| 2016 | $1,334 | $80,000 | $25,000 | $55,000 |
| 2015 | $1,585 | $99,000 | $41,000 | $58,000 |
| 2014 | $1,662 | $105,000 | $44,000 | $61,000 |
Source: Public Records
Map
Nearby Homes
- 72629 Edgehill Dr Unit 2
- 46835 Highway 74 Unit 3
- 72694 Eagle Rd Unit 3
- 134 Vista Valle
- 72765 Mesquite Ct Unit D
- 72644 Raven Rd Unit 2
- 72670 Thrush Rd Unit 4
- 72725 Jack Kramer Ln
- 72847 Don Larson Ln
- 72930 Willow St
- 72690 Yucca Ct
- 46183 Highway 74 Unit 20
- 72917 Arthur Ashe Ln
- 72730 Yucca Ct
- 72869 Don Larson Ln
- 72853 Don Larson Ln
- 72864 Roy Emerson Ln
- 46123 Highway 74
- 72890 Amber St
- 126 Vista Monte
- 72732 Bursera Way
- 72732 Bursera Way
- 72732 Bursera Way Unit 4
- 72732 Bursera Way Unit 3
- 72732 Bursera Way Unit 1
- 72712 Bursera Way
- 72712 Bursera Way Unit 4
- 72712 Bursera Way Unit 3
- 72712 Bursera Way Unit 2
- 72712 Bursera Way Unit 1
- 72740 Bursera Way Unit 4
- 72740 Bursera Way Unit 3
- 72740 Bursera Way Unit 4
- 72740 Bursera Way Unit 2
- 72740 Bursera Way Unit 1
- 72698 Bursera Way
- 72698 Bursera Way Unit 3
- 72698 Bursera Way Unit 4
- 72698 Bursera Way Unit 3
- 72698 Bursera Way Unit 2