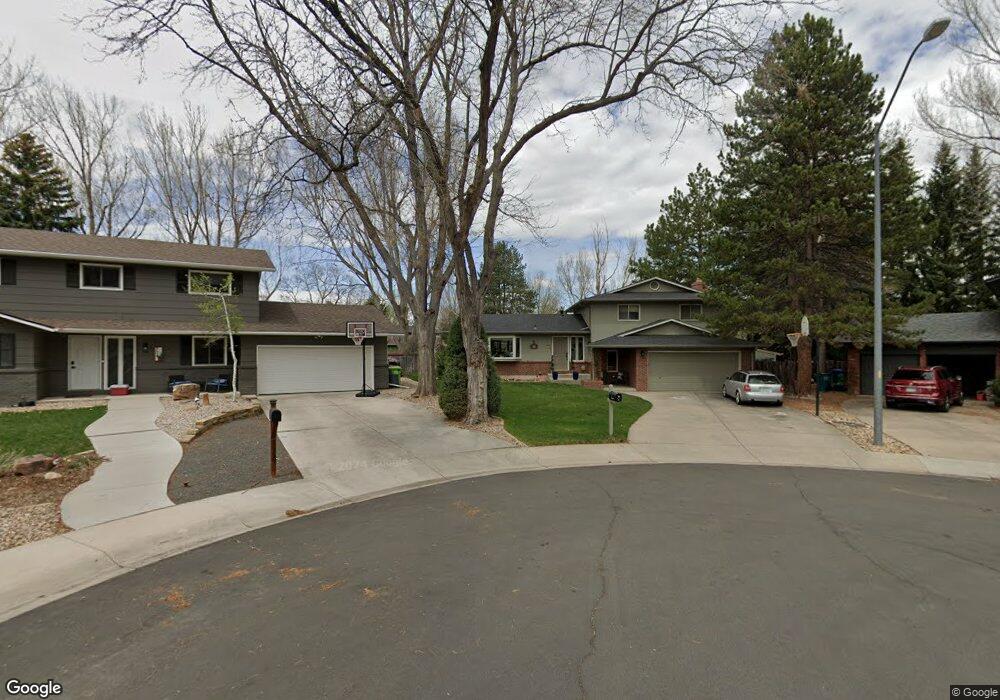
728 Duke Square Fort Collins, CO 80525
Mission Hills NeighborhoodEstimated Value: $621,090 - $864,000
4
Beds
3
Baths
1,788
Sq Ft
$397/Sq Ft
Est. Value
About This Home
This home is located at 728 Duke Square, Fort Collins, CO 80525 and is currently estimated at $710,023, approximately $397 per square foot. 728 Duke Square is a home located in Larimer County with nearby schools including O'Dea Elementary School, Lesher Middle School, and Fort Collins High School.
Ownership History
Date
Name
Owned For
Owner Type
Purchase Details
Closed on
Jun 24, 2002
Sold by
Braden Cindy L
Bought by
Braden Douglas L and Braden Cindy L
Current Estimated Value
Home Financials for this Owner
Home Financials are based on the most recent Mortgage that was taken out on this home.
Original Mortgage
$194,000
Outstanding Balance
$80,227
Interest Rate
6.5%
Estimated Equity
$629,796
Purchase Details
Closed on
Aug 1, 1997
Sold by
Meleski Mark S
Bought by
Braden Douglas L and Braden Cindy L
Home Financials for this Owner
Home Financials are based on the most recent Mortgage that was taken out on this home.
Original Mortgage
$129,750
Interest Rate
10.49%
Purchase Details
Closed on
Feb 1, 1993
Sold by
Clark Robert A
Bought by
Meleski Mark S
Create a Home Valuation Report for This Property
The Home Valuation Report is an in-depth analysis detailing your home's value as well as a comparison with similar homes in the area
Home Values in the Area
Average Home Value in this Area
Purchase History
| Date | Buyer | Sale Price | Title Company |
|---|---|---|---|
| Braden Douglas L | -- | -- | |
| Braden Douglas L | $173,000 | -- | |
| Meleski Mark S | $124,000 | -- |
Source: Public Records
Mortgage History
| Date | Status | Borrower | Loan Amount |
|---|---|---|---|
| Open | Braden Douglas L | $194,000 | |
| Closed | Braden Douglas L | $129,750 |
Source: Public Records
Tax History Compared to Growth
Tax History
| Year | Tax Paid | Tax Assessment Tax Assessment Total Assessment is a certain percentage of the fair market value that is determined by local assessors to be the total taxable value of land and additions on the property. | Land | Improvement |
|---|---|---|---|---|
| 2025 | $2,873 | $40,327 | $3,350 | $36,977 |
| 2024 | $2,734 | $40,327 | $3,350 | $36,977 |
| 2022 | $2,730 | $28,912 | $3,475 | $25,437 |
| 2021 | $2,759 | $29,744 | $3,575 | $26,169 |
| 2020 | $2,529 | $27,027 | $3,575 | $23,452 |
| 2019 | $2,540 | $27,027 | $3,575 | $23,452 |
| 2018 | $2,231 | $24,480 | $3,600 | $20,880 |
| 2017 | $2,223 | $24,480 | $3,600 | $20,880 |
| 2016 | $1,910 | $20,927 | $3,980 | $16,947 |
| 2015 | $1,897 | $25,890 | $3,980 | $21,910 |
| 2014 | $2,006 | $21,990 | $3,980 | $18,010 |
Source: Public Records
Map
Nearby Homes
- 1850 Indian Hills Cir
- 836 Vanderbilt Ct
- 924 Vanderbilt Ct
- 1741 Brookhaven Cir E Unit D
- 1741 Brookhaven Cir E Unit A
- 2418 Amherst St
- 2442 Amherst St
- 925 Columbia Rd Unit 523
- 925 Columbia Rd Unit 716
- 925 Columbia Rd Unit 233
- 1909 Pawnee Dr
- 2460 Stover St
- 1917 S Lemay Ave
- 1658 Freewheel Dr
- 412 Baylor St
- 603 E Prospect Rd
- 1113 Parkwood Dr
- 511 E Prospect Rd
- 801 E Drake Rd Unit G80
- 705 E Drake Rd Unit O35
- 724 Duke Square
- 732 Duke Square
- 701 Dartmouth Trail
- 2104 Stover St
- 736 Duke Square
- 2108 Stover St
- 712 Duke Square
- 740 Duke Square
- 2112 Stover St
- 2014 Stover St
- 704 Dartmouth Trail
- 700 Duke Square
- 744 Duke Square
- 2017 Stover St
- 708 Dartmouth Trail
- 721 Duke Square
- 725 Duke Square
- 2101 Stover St
- 713 Duke Square
- 733 Duke Square