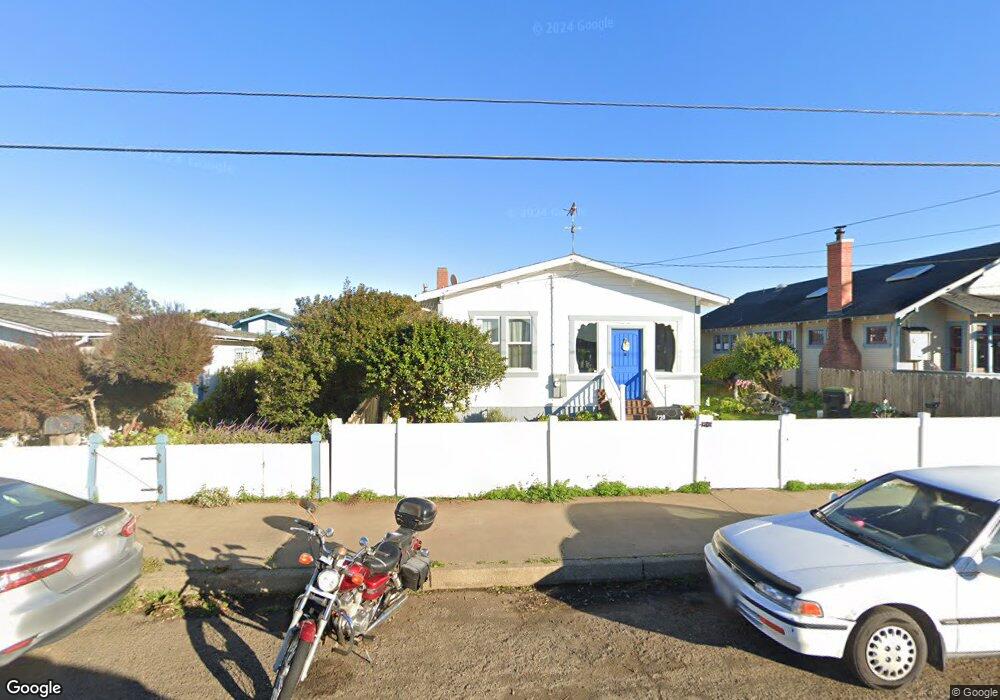
728 West St Fort Bragg, CA 95437
Estimated Value: $471,200 - $525,000
3
Beds
1
Bath
1,265
Sq Ft
$390/Sq Ft
Est. Value
About This Home
This home is located at 728 West St, Fort Bragg, CA 95437 and is currently estimated at $493,550, approximately $390 per square foot. 728 West St is a home located in Mendocino County with nearby schools including Fort Bragg High School and Three Rivers Charter School.
Ownership History
Date
Name
Owned For
Owner Type
Purchase Details
Closed on
Nov 27, 2019
Sold by
Terry Thomas
Bought by
Fulton Andy L and Fulton Jennifer J
Current Estimated Value
Home Financials for this Owner
Home Financials are based on the most recent Mortgage that was taken out on this home.
Original Mortgage
$367,815
Outstanding Balance
$324,282
Interest Rate
3.6%
Mortgage Type
New Conventional
Estimated Equity
$169,268
Purchase Details
Closed on
Nov 25, 2019
Sold by
Terry Thomas and Thomas Robin
Bought by
Fulton Andy L and Fulton Jennifer J
Home Financials for this Owner
Home Financials are based on the most recent Mortgage that was taken out on this home.
Original Mortgage
$367,815
Outstanding Balance
$324,282
Interest Rate
3.6%
Mortgage Type
New Conventional
Estimated Equity
$169,268
Purchase Details
Closed on
Sep 29, 2017
Sold by
Thomas Terry
Bought by
Thomas Terry and Thomas Robin
Purchase Details
Closed on
Jan 20, 2015
Sold by
Liljeberg Juanita F
Bought by
Liljeberg Juanita F
Create a Home Valuation Report for This Property
The Home Valuation Report is an in-depth analysis detailing your home's value as well as a comparison with similar homes in the area
Home Values in the Area
Average Home Value in this Area
Purchase History
| Date | Buyer | Sale Price | Title Company |
|---|---|---|---|
| Fulton Andy L | $374,500 | Redwood Empire Title | |
| Fulton Andy L | $374,500 | Redwood Empire Title | |
| Thomas Terry | -- | None Available | |
| Liljeberg Juanita F | -- | None Available |
Source: Public Records
Mortgage History
| Date | Status | Borrower | Loan Amount |
|---|---|---|---|
| Open | Fulton Andy L | $367,815 | |
| Closed | Fulton Andy L | $367,815 |
Source: Public Records
Tax History Compared to Growth
Tax History
| Year | Tax Paid | Tax Assessment Tax Assessment Total Assessment is a certain percentage of the fair market value that is determined by local assessors to be the total taxable value of land and additions on the property. | Land | Improvement |
|---|---|---|---|---|
| 2025 | $4,685 | $409,674 | $147,202 | $262,472 |
| 2023 | $4,685 | $393,768 | $141,487 | $252,281 |
| 2022 | $4,658 | $386,048 | $138,713 | $247,335 |
| 2021 | $4,390 | $378,480 | $135,994 | $242,486 |
| 2020 | $4,298 | $374,600 | $134,600 | $240,000 |
| 2019 | $643 | $42,162 | $11,004 | $31,158 |
| 2018 | $636 | $41,335 | $10,788 | $30,547 |
| 2017 | $22 | $40,525 | $10,577 | $29,948 |
| 2016 | $22 | $39,730 | $10,369 | $29,361 |
| 2015 | $22 | $39,134 | $10,214 | $28,920 |
| 2014 | $18 | $38,367 | $10,013 | $28,354 |
Source: Public Records
Map
Nearby Homes
- 715 West St
- 119 E Pine St
- 944 Stewart St
- 924 Glass Beach Dr
- 423 N Franklin St
- 142 S Franklin St
- 1184 N Main St Unit 1
- 251 S Franklin St
- 459 S Mcpherson St
- 443 S Harrison St
- 494 S Whipple St
- 571 S Franklin St
- 575 S Whipple St
- 215 S Sanderson Way
- 517 S Lincoln St
- 1261 N Main St
- 32000 Airport Rd
- 854 Woodward St
- 300 N Harbor Dr
- 19351 Del Mar Dr