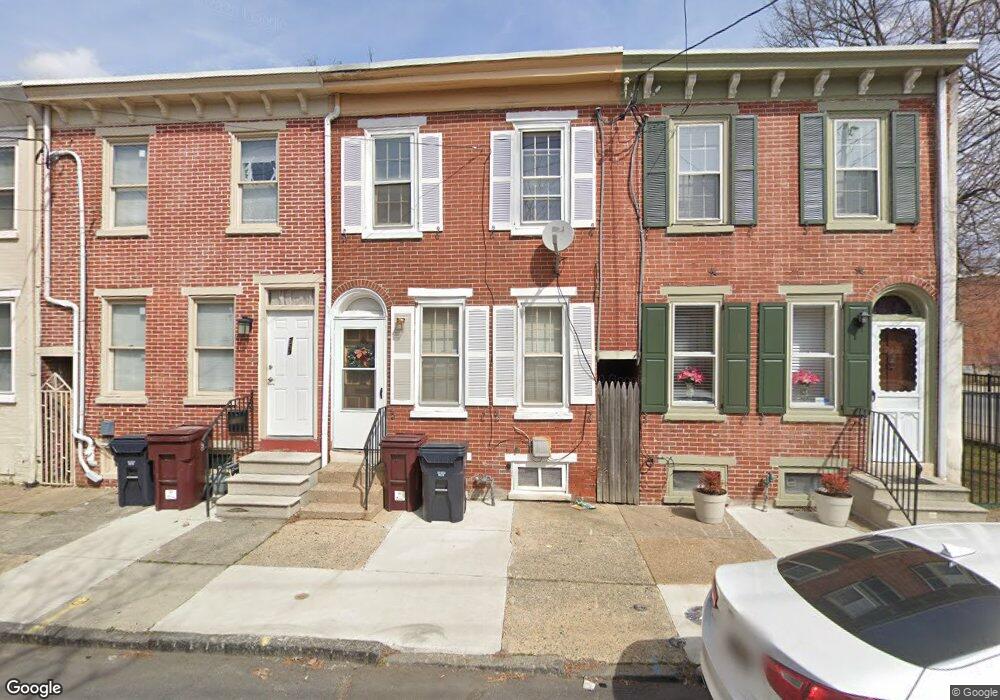
729 E 7th St Wilmington, DE 19801
Downtown Wilmington NeighborhoodEstimated Value: $155,000 - $228,000
3
Beds
2
Baths
1,328
Sq Ft
$138/Sq Ft
Est. Value
About This Home
This home is located at 729 E 7th St, Wilmington, DE 19801 and is currently estimated at $183,434, approximately $138 per square foot. 729 E 7th St is a home located in New Castle County with nearby schools including The Bancroft School, The Bayard School, and Newark High School.
Ownership History
Date
Name
Owned For
Owner Type
Purchase Details
Closed on
Oct 7, 2025
Sold by
Merced Angel
Bought by
A L Merced Properties Llc
Current Estimated Value
Purchase Details
Closed on
Feb 26, 2004
Sold by
Hooley Paul
Bought by
A L Merced Properties Llc
Home Financials for this Owner
Home Financials are based on the most recent Mortgage that was taken out on this home.
Original Mortgage
$6,500
Interest Rate
5.65%
Mortgage Type
Seller Take Back
Create a Home Valuation Report for This Property
The Home Valuation Report is an in-depth analysis detailing your home's value as well as a comparison with similar homes in the area
Home Values in the Area
Average Home Value in this Area
Purchase History
| Date | Buyer | Sale Price | Title Company |
|---|---|---|---|
| A L Merced Properties Llc | -- | None Listed On Document | |
| A L Merced Properties Llc | $13,000 | -- |
Source: Public Records
Mortgage History
| Date | Status | Borrower | Loan Amount |
|---|---|---|---|
| Previous Owner | A L Merced Properties Llc | $6,500 |
Source: Public Records
Tax History
| Year | Tax Paid | Tax Assessment Tax Assessment Total Assessment is a certain percentage of the fair market value that is determined by local assessors to be the total taxable value of land and additions on the property. | Land | Improvement |
|---|---|---|---|---|
| 2024 | $734 | $19,900 | $1,800 | $18,100 |
| 2023 | $715 | $19,900 | $1,800 | $18,100 |
| 2022 | $708 | $19,900 | $1,800 | $18,100 |
| 2021 | $690 | $19,900 | $1,800 | $18,100 |
| 2020 | $0 | $19,900 | $1,800 | $18,100 |
| 2019 | $980 | $19,900 | $1,800 | $18,100 |
| 2018 | $572 | $19,900 | $1,800 | $18,100 |
| 2017 | $555 | $19,900 | $1,800 | $18,100 |
| 2016 | $554 | $19,900 | $1,800 | $18,100 |
| 2015 | $864 | $19,900 | $1,800 | $18,100 |
| 2014 | $864 | $19,900 | $1,800 | $18,100 |
Source: Public Records
Map
Nearby Homes
- 810 N Church St
- 820 N Church St
- 701 E 6th St
- 836 Bennett St
- 841 Bennett St
- 850 Bennett St
- 847 Bennett St
- 849 Bennett St
- 901 N Church St
- 801 N Church St
- 524 Taylor St
- 903 Kirkwood St
- 508 Taylor St
- 936 N Spruce St
- 739 E 10th St
- 1007 N Spruce St
- 912 N Lombard St
- 914 N Lombard St
- 511 E 3rd St
- 1013 N Pine St
Your Personal Tour Guide
Ask me questions while you tour the home.