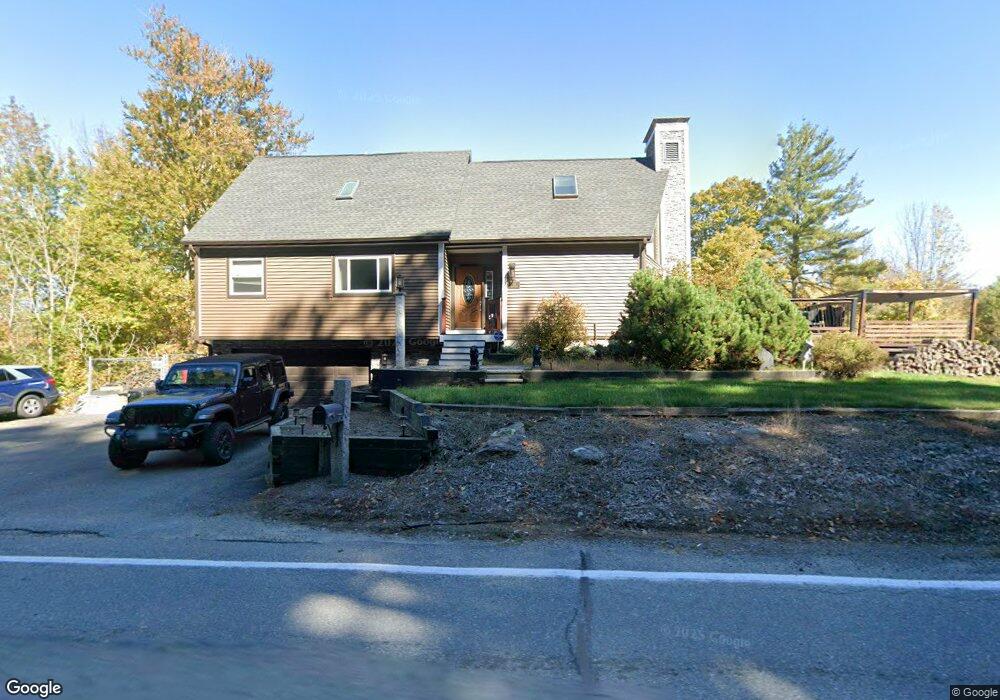
73 Depot Rd Westminster, MA 01473
Estimated Value: $564,721 - $614,000
3
Beds
2
Baths
1,891
Sq Ft
$310/Sq Ft
Est. Value
About This Home
This home is located at 73 Depot Rd, Westminster, MA 01473 and is currently estimated at $586,680, approximately $310 per square foot. 73 Depot Rd is a home located in Worcester County with nearby schools including Oakmont Regional High School and Applewild School.
Ownership History
Date
Name
Owned For
Owner Type
Purchase Details
Closed on
Jan 31, 2006
Sold by
Pavlovic Gail and Pavlovic Richard
Bought by
Bigusiak Stephen M
Current Estimated Value
Home Financials for this Owner
Home Financials are based on the most recent Mortgage that was taken out on this home.
Original Mortgage
$268,000
Interest Rate
6.34%
Mortgage Type
Purchase Money Mortgage
Purchase Details
Closed on
Aug 29, 2002
Sold by
Garstka Marsha L and Garstka John A
Bought by
Pavlovic Richard and Pavlovic Gail
Home Financials for this Owner
Home Financials are based on the most recent Mortgage that was taken out on this home.
Original Mortgage
$160,000
Interest Rate
6.55%
Mortgage Type
Purchase Money Mortgage
Purchase Details
Closed on
Nov 20, 1998
Sold by
Cournoyer Roger and Cournoyer Beverly
Bought by
Eaton Marsha L and Garstka John A
Create a Home Valuation Report for This Property
The Home Valuation Report is an in-depth analysis detailing your home's value as well as a comparison with similar homes in the area
Home Values in the Area
Average Home Value in this Area
Purchase History
| Date | Buyer | Sale Price | Title Company |
|---|---|---|---|
| Bigusiak Stephen M | $335,000 | -- | |
| Pavlovic Richard | $268,500 | -- | |
| Eaton Marsha L | $168,500 | -- |
Source: Public Records
Mortgage History
| Date | Status | Borrower | Loan Amount |
|---|---|---|---|
| Open | Eaton Marsha L | $270,500 | |
| Closed | Bigusiak Stephen M | $268,000 | |
| Closed | Bigusiak Stephen M | $50,250 | |
| Previous Owner | Eaton Marsha L | $160,000 |
Source: Public Records
Tax History Compared to Growth
Tax History
| Year | Tax Paid | Tax Assessment Tax Assessment Total Assessment is a certain percentage of the fair market value that is determined by local assessors to be the total taxable value of land and additions on the property. | Land | Improvement |
|---|---|---|---|---|
| 2025 | $5,180 | $421,100 | $107,300 | $313,800 |
| 2024 | $4,932 | $402,300 | $107,300 | $295,000 |
| 2023 | $4,695 | $359,500 | $100,100 | $259,400 |
| 2022 | $4,798 | $303,700 | $87,200 | $216,500 |
| 2021 | $4,705 | $280,700 | $75,000 | $205,700 |
| 2020 | $4,838 | $261,000 | $68,200 | $192,800 |
| 2019 | $4,546 | $249,100 | $56,300 | $192,800 |
| 2018 | $4,389 | $236,600 | $56,300 | $180,300 |
| 2017 | $4,264 | $234,400 | $56,300 | $178,100 |
| 2016 | $4,306 | $229,300 | $46,900 | $182,400 |
| 2015 | $4,345 | $229,300 | $46,900 | $182,400 |
| 2014 | $4,352 | $229,300 | $46,900 | $182,400 |
Source: Public Records
Map
Nearby Homes
- 26 Bathrick Rd
- 16 Old Mill Cir
- 22 Heritage Ln
- 55 Newcomb Rd
- 47 Newcomb Rd
- 25 Newcomb Rd
- 1317 Westminster St
- 51 State Rd E
- 169 Narrows Rd
- 139 Parson Cir
- 82 Narrows Rd
- 5 Linda Dr Unit The Connor
- 15 Cascade St
- 11 Syd Smith Rd
- 2 Old Town Farm Rd
- 0 Syd Smith Rd (Rear)
- 0 Syd Smith Rd Map 71 Lot 4-2
- 0
- 0 Syd Smith Rd Unit 73395578
- 73 N Common Rd
- 74 Depot Rd
- 165 State Rd E
- 159 State Rd E
- 157 State Rd E
- 1 Bartherick Rd Unit R
- 0 Bathrick Unit 72295752
- Lot 1 Bartherick
- 1 Bathrick
- 155 State Rd E
- 27C1 Bartherick Rd
- 27B1 Bartherick Rd
- 160 State Rd E
- Lot 3 Bartherick Rd
- 158 State Rd E
- 156 State Rd E
- 156 State Rd E Unit 156
- 164 State Rd E
- 170 State Rd E Unit 2
- 170 State Rd E
- 6 Bartherick Rd