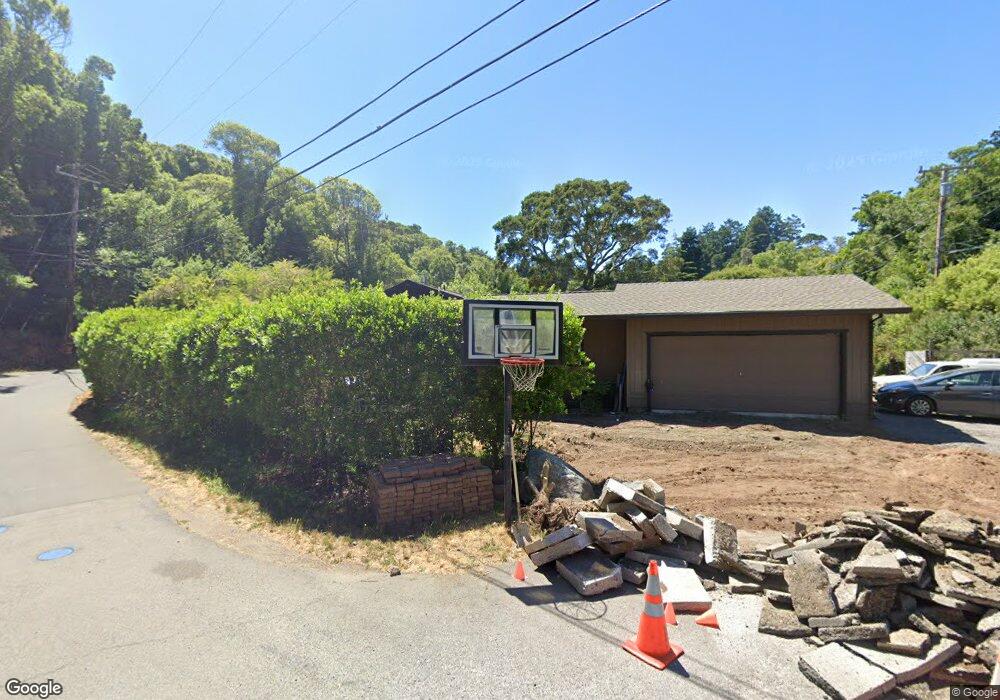
73 Inverness Way Inverness, CA 94937
Estimated Value: $664,000 - $1,364,000
3
Beds
2
Baths
1,280
Sq Ft
$835/Sq Ft
Est. Value
About This Home
This home is located at 73 Inverness Way, Inverness, CA 94937 and is currently estimated at $1,068,747, approximately $834 per square foot. 73 Inverness Way is a home located in Marin County with nearby schools including West Marin Elementary School and Tomales High School.
Ownership History
Date
Name
Owned For
Owner Type
Purchase Details
Closed on
Sep 8, 2014
Sold by
Community Land Trust Association Of West
Bought by
Oldmixon Eric and Myers Sarah
Current Estimated Value
Purchase Details
Closed on
Dec 5, 2012
Sold by
Jp Morgan Chase Bank N A
Bought by
Community Land Trust Association Of West
Purchase Details
Closed on
Apr 10, 2012
Sold by
Rocca Suzanne Doris
Bought by
Jp Morgan Chase Bank N A
Purchase Details
Closed on
Nov 7, 1997
Sold by
Rocca Suzanne D and Doris Suzanne
Bought by
Rocca Suzanne Doris
Home Financials for this Owner
Home Financials are based on the most recent Mortgage that was taken out on this home.
Original Mortgage
$128,500
Interest Rate
4.7%
Create a Home Valuation Report for This Property
The Home Valuation Report is an in-depth analysis detailing your home's value as well as a comparison with similar homes in the area
Home Values in the Area
Average Home Value in this Area
Purchase History
| Date | Buyer | Sale Price | Title Company |
|---|---|---|---|
| Oldmixon Eric | $300,000 | Old Republic Title Company | |
| Community Land Trust Association Of West | $309,000 | North American Title Co Inc | |
| Jp Morgan Chase Bank N A | $273,000 | Accommodation | |
| Rocca Suzanne Doris | -- | First American Title Co |
Source: Public Records
Mortgage History
| Date | Status | Borrower | Loan Amount |
|---|---|---|---|
| Previous Owner | Rocca Suzanne Doris | $128,500 |
Source: Public Records
Tax History Compared to Growth
Tax History
| Year | Tax Paid | Tax Assessment Tax Assessment Total Assessment is a certain percentage of the fair market value that is determined by local assessors to be the total taxable value of land and additions on the property. | Land | Improvement |
|---|---|---|---|---|
| 2025 | $4,463 | $360,542 | $1 | $360,541 |
| 2024 | $4,463 | $353,474 | $1 | $353,473 |
| 2023 | $4,356 | $346,545 | $1 | $346,544 |
| 2022 | $4,307 | $339,750 | $1 | $339,749 |
| 2021 | $4,255 | $336,268 | $1 | $336,267 |
| 2020 | $6,107 | $494,514 | $164,838 | $329,676 |
| 2019 | $5,884 | $484,821 | $161,607 | $323,214 |
| 2018 | $5,765 | $475,317 | $158,439 | $316,878 |
| 2017 | $5,624 | $465,997 | $155,332 | $310,665 |
| 2016 | $5,378 | $456,862 | $152,287 | $304,575 |
| 2015 | $5,369 | $450,000 | $150,000 | $300,000 |
| 2014 | $3,780 | $310,402 | $150,681 | $159,721 |
Source: Public Records
Map
Nearby Homes
- 95 Highland Way
- 50 Dundee Way
- 10 Miwok Way
- 531 Via de la Vista
- 0 W Robert Dr
- 0 Douglas Dr
- 1 Dover Rd
- 17523 California 1
- 5 Mc Donald Ln
- 1208 Pierce Point Rd
- 11160 Sir Francis Drake Blvd
- 11150 Sir Francis Drake Blvd
- 10905 State Route 1
- 70 Fox Dr
- 1 Dillon Beach Rd
- 200 Road To Ranch
- 58 Red Barn Ct
- 22 Red Barn Ct
- 50&52 Red Barn Ct
- 62&64 Red Barn Ct
- 95 Inverness Dr
- 87 Inverness Dr
- 83 Inverness Dr
- 77 Inverness Dr
- 67 Inverness Dr
- 67 Inverness Way
- 216 Hawthornden Way
- 35 Highland Ave
- 63 Inverness Dr
- 87 Inverness Way
- 47 Inverness Dr
- 25 Forres Way
- 4 Glen Way
- 65 Bruce St
- 30 Laurel Ave
- 91 Inverness Way
- 59 Inverness Dr
- 90 Laurel View Way
- 24 Glen Way
- 80 Laurel View Way