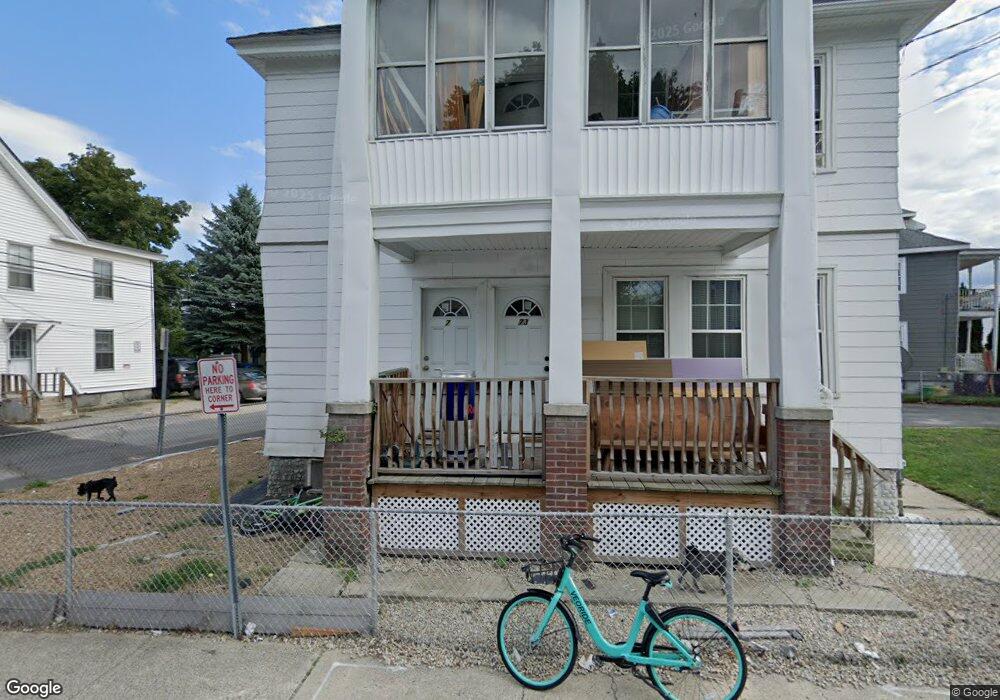
73 Lock St Unit 75 Nashua, NH 03064
North End Nashua NeighborhoodEstimated Value: $504,446 - $557,000
6
Beds
2
Baths
2,464
Sq Ft
$215/Sq Ft
Est. Value
About This Home
This home is located at 73 Lock St Unit 75, Nashua, NH 03064 and is currently estimated at $529,362, approximately $214 per square foot. 73 Lock St Unit 75 is a home located in Hillsborough County with nearby schools including Mount Pleasant Elementary School, Pennichuck Middle School, and Nashua High School North.
Ownership History
Date
Name
Owned For
Owner Type
Purchase Details
Closed on
Nov 30, 2009
Sold by
Nellis Robert C
Bought by
Priore Christopher
Current Estimated Value
Home Financials for this Owner
Home Financials are based on the most recent Mortgage that was taken out on this home.
Original Mortgage
$215,523
Outstanding Balance
$140,151
Interest Rate
4.92%
Mortgage Type
Purchase Money Mortgage
Estimated Equity
$389,211
Purchase Details
Closed on
Nov 26, 2008
Sold by
Rodriguez Daniel Aritides and Lasalle Bank Na
Bought by
Nellis Robert C
Purchase Details
Closed on
Jul 22, 2005
Sold by
Vermette Blanche A
Bought by
Rodriguez Daniel
Home Financials for this Owner
Home Financials are based on the most recent Mortgage that was taken out on this home.
Original Mortgage
$267,200
Interest Rate
5.59%
Mortgage Type
Purchase Money Mortgage
Create a Home Valuation Report for This Property
The Home Valuation Report is an in-depth analysis detailing your home's value as well as a comparison with similar homes in the area
Home Values in the Area
Average Home Value in this Area
Purchase History
| Date | Buyer | Sale Price | Title Company |
|---|---|---|---|
| Priore Christopher | $219,500 | -- | |
| Nellis Robert C | $110,000 | -- | |
| Rodriguez Daniel | $334,000 | -- |
Source: Public Records
Mortgage History
| Date | Status | Borrower | Loan Amount |
|---|---|---|---|
| Open | Rodriguez Daniel | $215,523 | |
| Previous Owner | Rodriguez Daniel | $151,500 | |
| Previous Owner | Rodriguez Daniel | $267,200 |
Source: Public Records
Tax History Compared to Growth
Tax History
| Year | Tax Paid | Tax Assessment Tax Assessment Total Assessment is a certain percentage of the fair market value that is determined by local assessors to be the total taxable value of land and additions on the property. | Land | Improvement |
|---|---|---|---|---|
| 2024 | $8,203 | $515,900 | $113,400 | $402,500 |
| 2023 | $6,973 | $382,500 | $90,700 | $291,800 |
| 2022 | $6,912 | $382,500 | $90,700 | $291,800 |
| 2021 | $5,766 | $248,300 | $60,500 | $187,800 |
| 2020 | $5,614 | $248,300 | $60,500 | $187,800 |
| 2019 | $5,403 | $248,300 | $60,500 | $187,800 |
| 2018 | $5,266 | $248,300 | $60,500 | $187,800 |
| 2017 | $5,367 | $208,100 | $70,600 | $137,500 |
| 2016 | $5,217 | $208,100 | $70,600 | $137,500 |
| 2015 | $5,105 | $208,100 | $70,600 | $137,500 |
| 2014 | -- | $207,400 | $70,600 | $136,800 |
Source: Public Records
Map
Nearby Homes
- 13 Sapphire Ln
- 15 Atherton Ave
- 19 Atherton Ave
- 36-38 Courtland St
- 71 Concord St
- 21 Edson St
- 18 Harbor Ave Unit 208
- 4 Chase St
- 13 Mulvanity St
- 11 Charles St
- 5 Mulberry St
- 4 Reservoir St
- 61 Manchester St
- 434 Abbott Farm Ln
- 213 Abbott Farm Ln
- 312 Abbott Farm Ln
- 24 E Otterson St
- 38 Central St
- 73 Berkeley St
- 19 Bartlett Ave
- 17 Lucier St
- 15 Lucier St
- 74 Lock St Unit 741/2
- 71 Lock St
- 76 Lock St
- 72A Lock St Unit 72B
- 11 Lucier St Unit 45-14
- 11 Lucier St Unit 45-15
- 11 Lucier St
- 79 Lock St Unit 81
- 78 3/4 Lock St
- 12 Lucier St
- 70 Lock St Unit 70
- 69 Lock St
- 72 1/2 Lock Unit 72H
- 3 Lucier St
- 64 Chandler St Unit 70
- 72 Lock St Unit 72
- 4 Lessard St Unit 10
- 70 1/2 Lock St Unit 70H