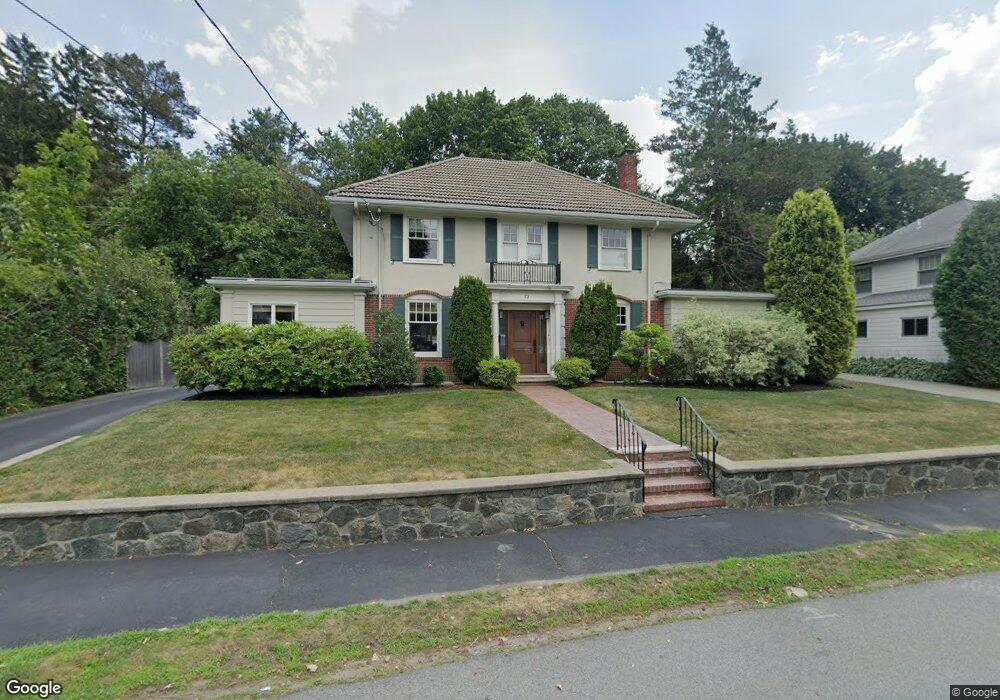
73 Morton Rd Swampscott, MA 01907
Estimated Value: $1,132,000 - $1,334,000
4
Beds
3
Baths
2,505
Sq Ft
$487/Sq Ft
Est. Value
About This Home
This home is located at 73 Morton Rd, Swampscott, MA 01907 and is currently estimated at $1,219,262, approximately $486 per square foot. 73 Morton Rd is a home located in Essex County with nearby schools including Swampscott Middle School, Swampscott High School, and Devereux School.
Ownership History
Date
Name
Owned For
Owner Type
Purchase Details
Closed on
Jul 1, 2021
Sold by
Meryl B Rich T
Bought by
Isaacson Dana and Kancher Jennifer
Current Estimated Value
Home Financials for this Owner
Home Financials are based on the most recent Mortgage that was taken out on this home.
Original Mortgage
$509,997
Outstanding Balance
$460,732
Interest Rate
2.9%
Mortgage Type
Purchase Money Mortgage
Estimated Equity
$758,530
Purchase Details
Closed on
Jan 8, 2009
Sold by
Rich Julian G and Rich Meryl B
Bought by
Rich Tr Meryl B
Purchase Details
Closed on
Jan 3, 1991
Sold by
Kirkpartick J Darrow
Bought by
Rich Julian G
Purchase Details
Closed on
Aug 2, 1988
Sold by
Freedman Mark R
Bought by
Kirkpatrick J Darrow
Create a Home Valuation Report for This Property
The Home Valuation Report is an in-depth analysis detailing your home's value as well as a comparison with similar homes in the area
Home Values in the Area
Average Home Value in this Area
Purchase History
| Date | Buyer | Sale Price | Title Company |
|---|---|---|---|
| Isaacson Dana | $860,000 | None Available | |
| Isaacson Dana | $860,000 | None Available | |
| Isaacson Dana | $860,000 | None Available | |
| Rich Tr Meryl B | -- | -- | |
| Rich Tr Meryl B | -- | -- | |
| Rich Julian G | $310,000 | -- | |
| Rich Julian G | $310,000 | -- | |
| Kirkpatrick J Darrow | $340,000 | -- |
Source: Public Records
Mortgage History
| Date | Status | Borrower | Loan Amount |
|---|---|---|---|
| Open | Isaacson Dana | $509,997 | |
| Closed | Isaacson Dana | $509,997 | |
| Previous Owner | Kirkpatrick J Darrow | $30,000 |
Source: Public Records
Tax History Compared to Growth
Tax History
| Year | Tax Paid | Tax Assessment Tax Assessment Total Assessment is a certain percentage of the fair market value that is determined by local assessors to be the total taxable value of land and additions on the property. | Land | Improvement |
|---|---|---|---|---|
| 2025 | $11,602 | $1,011,500 | $384,500 | $627,000 |
| 2024 | $11,288 | $982,400 | $365,700 | $616,700 |
| 2023 | $10,540 | $897,800 | $328,200 | $569,600 |
| 2022 | $10,596 | $825,900 | $281,300 | $544,600 |
| 2021 | $10,441 | $756,600 | $262,600 | $494,000 |
| 2020 | $10,706 | $748,700 | $262,600 | $486,100 |
| 2019 | $11,094 | $729,900 | $243,800 | $486,100 |
| 2018 | $11,366 | $710,400 | $243,800 | $466,600 |
| 2017 | $11,526 | $660,500 | $225,100 | $435,400 |
| 2016 | $11,323 | $653,400 | $218,000 | $435,400 |
| 2015 | $11,206 | $653,400 | $218,000 | $435,400 |
| 2014 | $11,055 | $591,200 | $218,000 | $373,200 |
Source: Public Records
Map
Nearby Homes
- 25 Manton Rd
- 37 Stanley Rd
- 48 Bellevue Rd
- 179 Beach Bluff Ave
- 24 Orchard Cir
- 212 Humphrey St Unit 205
- 201 Humphrey St Unit 2
- 19 Elmwood Rd
- 35 Alden Rd
- 9 Tedesco Pond Place Unit 9
- 2 Wilfred Terrace
- 1006 Paradise Rd Unit 3R
- 25 Tedesco St
- 1004 Paradise Rd Unit PHJ
- 35 Littles Point Rd Unit S201
- 71 Walnut Rd
- 6 Loring Hills Ave Unit D3
- 8 Ocean View Rd
- 309 Paradise Rd
- 110 Galloupes Point Rd