N
Landlord's Agent in 2019
Nancy Gioielli-Wong
Brown Harris Stevens
(203) 221-0666
1 Total Sale
Estimated Value: $950,000 - $1,273,000
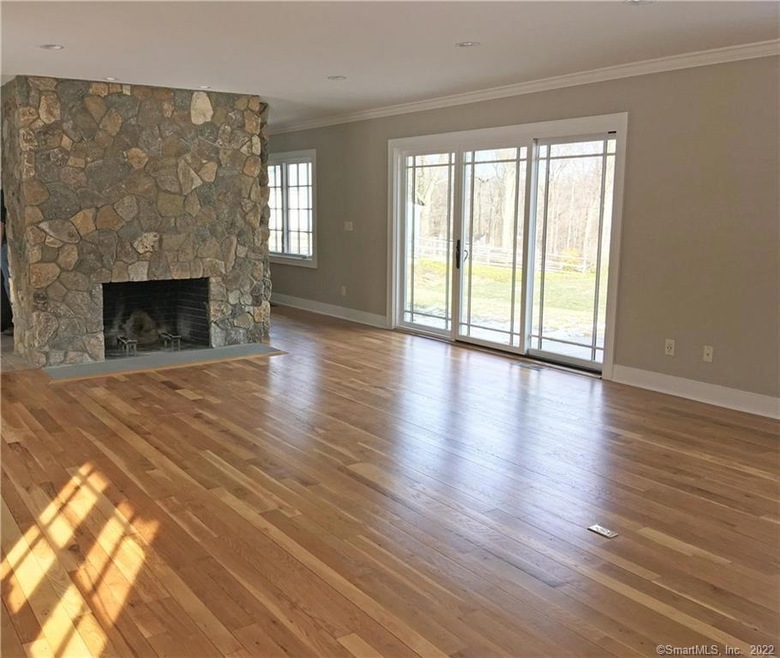
Let the sun shine in! This light, bright and delightful 3-BR/2.5 BA ranch-style home in Lower Weston offers a flexible floor plan, was completely renovated in 2017. Lovely kitchen w stainless steel appliances, granite counters and dining area. Dramatic floor-to-ceiling stone fireplace in living room & French doors to private patio. Laundry room with counters and cabinets for additional storage or pantry space. Located in convenient Lower Weston, the home is part of an estate, yet separate, and offers use of the tennis court and gazebo. Gracious private drive with stone wall and pillars, mature trees and peaceful setting. Enjoy easy living in this spacious home on beautiful property.
Close to Award-winning Weston schools and town center.
Last Agent to Rent the Property
Brown Harris Stevens License #RES.0762744 Listed on: 06/03/2019

| Date | Buyer | Sale Price | Title Company |
|---|---|---|---|
| Colhoun Kathleen | $350,000 | -- |
| Date | Status | Borrower | Loan Amount |
|---|---|---|---|
| Closed | Colhoun Kathleen | $1,160,000 |
| Date | Event | Price | List to Sale | Price per Sq Ft |
|---|---|---|---|---|
| 08/20/2019 08/20/19 | Rented | $3,300 | -16.5% | -- |
| 08/08/2019 08/08/19 | Under Contract | -- | -- | -- |
| 07/23/2019 07/23/19 | Price Changed | $3,950 | -1.3% | $2 / Sq Ft |
| 07/02/2019 07/02/19 | Price Changed | $4,000 | -9.1% | $2 / Sq Ft |
| 06/03/2019 06/03/19 | For Rent | $4,400 | 0.0% | -- |
| 02/14/2017 02/14/17 | Rented | $4,400 | +7.3% | -- |
| 02/11/2017 02/11/17 | Under Contract | -- | -- | -- |
| 01/13/2017 01/13/17 | For Rent | $4,100 | -- | -- |
| Year | Tax Paid | Tax Assessment Tax Assessment Total Assessment is a certain percentage of the fair market value that is determined by local assessors to be the total taxable value of land and additions on the property. | Land | Improvement |
|---|---|---|---|---|
| 2025 | $11,918 | $498,680 | $189,000 | $309,680 |
| 2024 | $11,704 | $498,680 | $189,000 | $309,680 |
| 2023 | $11,407 | $345,050 | $189,010 | $156,040 |
| 2022 | $11,376 | $345,050 | $189,010 | $156,040 |
| 2021 | $11,359 | $345,050 | $189,010 | $156,040 |
| 2020 | $11,169 | $345,050 | $189,010 | $156,040 |
| 2019 | $11,169 | $345,050 | $189,010 | $156,040 |
| 2018 | $10,225 | $347,900 | $210,000 | $137,900 |
| 2017 | $9,696 | $335,400 | $210,000 | $125,400 |
| 2016 | $8,445 | $295,700 | $210,000 | $85,700 |
| 2015 | $8,504 | $295,700 | $210,000 | $85,700 |
| 2014 | $8,351 | $295,700 | $210,000 | $85,700 |
N
Landlord's Agent in 2019
Nancy Gioielli-Wong
Brown Harris Stevens
(203) 221-0666
1 Total Sale
L
Tenant's Agent in 2019
Lorrie Craw
William Raveis Real Estate
(203) 261-0028
2 in this area
2 Total Sales
Buyer's Agent in 2017
Julie Walsh
Coldwell Banker Realty
(203) 227-8424
3 in this area
45 Total Sales
Source: SmartMLS
MLS Number: 170202222
APN: WSTN-000020-000002-000112
Disclaimer: Certain information contained herein is derived from information provided by parties other than Homes.com. All information provided is deemed reliable, but is not guaranteed to be accurate and should be independently verified.
![]() IDX information is provided exclusively for personal, non-commercial use, and may not be used for any purpose other than to identify prospective properties consumers may be interested in purchasing. Information is deemed reliable but not guaranteed.
IDX information is provided exclusively for personal, non-commercial use, and may not be used for any purpose other than to identify prospective properties consumers may be interested in purchasing. Information is deemed reliable but not guaranteed.
Ask me questions while you tour the home.