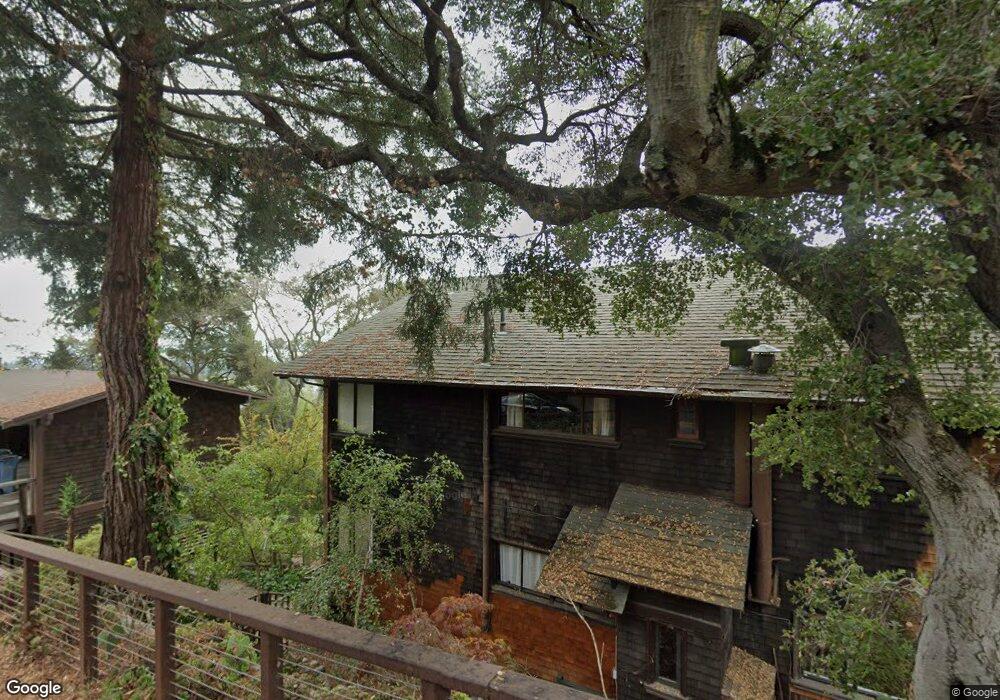
73 Panoramic Way Berkeley, CA 94704
Estimated Value: $613,240 - $724,000
1
Bed
1
Bath
733
Sq Ft
$907/Sq Ft
Est. Value
About This Home
This home is located at 73 Panoramic Way, Berkeley, CA 94704 and is currently estimated at $665,060, approximately $907 per square foot. 73 Panoramic Way is a home located in Alameda County with nearby schools including Emerson Elementary School, John Muir Elementary School, and Malcolm X Elementary School.
Ownership History
Date
Name
Owned For
Owner Type
Purchase Details
Closed on
Jun 2, 2021
Sold by
Proctor Elizabeth J and Webster Michael A
Bought by
Proctor Elizabeth J and Webster Michael A
Current Estimated Value
Home Financials for this Owner
Home Financials are based on the most recent Mortgage that was taken out on this home.
Original Mortgage
$500,000
Outstanding Balance
$452,688
Interest Rate
2.9%
Mortgage Type
New Conventional
Estimated Equity
$212,372
Purchase Details
Closed on
Dec 22, 2018
Sold by
Proctor Elizabeth J and Webster Michael A
Bought by
Proctor Elizabeth J and Webster Michael A
Purchase Details
Closed on
Aug 25, 2017
Sold by
Luckenbach Carol and Arimitsu Koichi
Bought by
Proctor Elizabeth J and Webster Michael A
Home Financials for this Owner
Home Financials are based on the most recent Mortgage that was taken out on this home.
Original Mortgage
$526,500
Interest Rate
3.92%
Mortgage Type
New Conventional
Create a Home Valuation Report for This Property
The Home Valuation Report is an in-depth analysis detailing your home's value as well as a comparison with similar homes in the area
Purchase History
| Date | Buyer | Sale Price | Title Company |
|---|---|---|---|
| Proctor Elizabeth J | -- | Old Republic Title Company | |
| Proctor Elizabeth J | -- | Old Republic Title Company | |
| Proctor Elizabeth J | -- | None Available | |
| Proctor Elizabeth J | $585,000 | First American Title Company | |
| Arimitsu Koichi | -- | First American Title Company |
Source: Public Records
Mortgage History
| Date | Status | Borrower | Loan Amount |
|---|---|---|---|
| Open | Proctor Elizabeth J | $500,000 | |
| Closed | Proctor Elizabeth J | $526,500 |
Source: Public Records
Tax History
| Year | Tax Paid | Tax Assessment Tax Assessment Total Assessment is a certain percentage of the fair market value that is determined by local assessors to be the total taxable value of land and additions on the property. | Land | Improvement |
|---|---|---|---|---|
| 2025 | $9,395 | $665,618 | $199,685 | $465,933 |
| 2024 | $9,395 | $652,567 | $195,770 | $456,797 |
| 2023 | $9,208 | $639,773 | $191,932 | $447,841 |
| 2022 | $9,065 | $627,230 | $188,169 | $439,061 |
| 2021 | $9,098 | $614,934 | $184,480 | $430,454 |
| 2020 | $8,678 | $608,633 | $182,590 | $426,043 |
| 2019 | $8,408 | $596,700 | $179,010 | $417,690 |
| 2018 | $8,281 | $585,000 | $175,500 | $409,500 |
| 2017 | $5,686 | $383,838 | $115,151 | $268,687 |
| 2016 | $5,513 | $376,312 | $112,893 | $263,419 |
| 2015 | $5,442 | $370,662 | $111,198 | $259,464 |
| 2014 | $5,410 | $363,403 | $109,020 | $254,383 |
Source: Public Records
Map
Nearby Homes
- 2 Panoramic Way Unit 105
- 2 Panoramic Way Unit 304
- 0 Panoramic Way Unit 41118724
- 39 Canyon Rd
- 161 Panoramic Way
- 3382 Dwight Way
- 2611 Piedmont Ave Unit 4
- 2632 Warring St Unit 3
- 2601 College Ave Unit 203
- 2601 College Ave Unit 208
- 2509 Dwight Way
- 2817 Palm Ct
- 190 Stonewall Rd
- 2643 Stuart St
- 2535 Chilton Way
- 2700 Le Conte Ave Unit 301
- 2700 Le Conte Ave Unit 402
- 2550 Dana St Unit 2F
- 2634 Virginia St Unit 13
- 2702 Dana St
- 75 Panoramic Way
- 77 Panoramic Way
- 77 Panoramic Way
- 77 Panoramic Way
- 74 Panoramic Way
- 23 Panoramic Way
- 25 Panoramic Way
- 11 Panoramic Way Unit 6
- 9 Panoramic Way Unit 4
- 7 Panoramic Way
- 5 Panoramic Way
- 5 Panoramic Way
- 94 Panoramic Way
- 3 Orchard Ln
- 27 Panoramic Way
- 70 Panoramic Way
- 107 Panoramic Way
- 109 Panoramic Way
- 101 Panoramic Way
- 111 Panoramic Way
Your Personal Tour Guide
Ask me questions while you tour the home.