73 Sherman Rd Unit 1 Dedham, MA 02026
The Manor NeighborhoodEstimated Value: $531,000 - $621,000
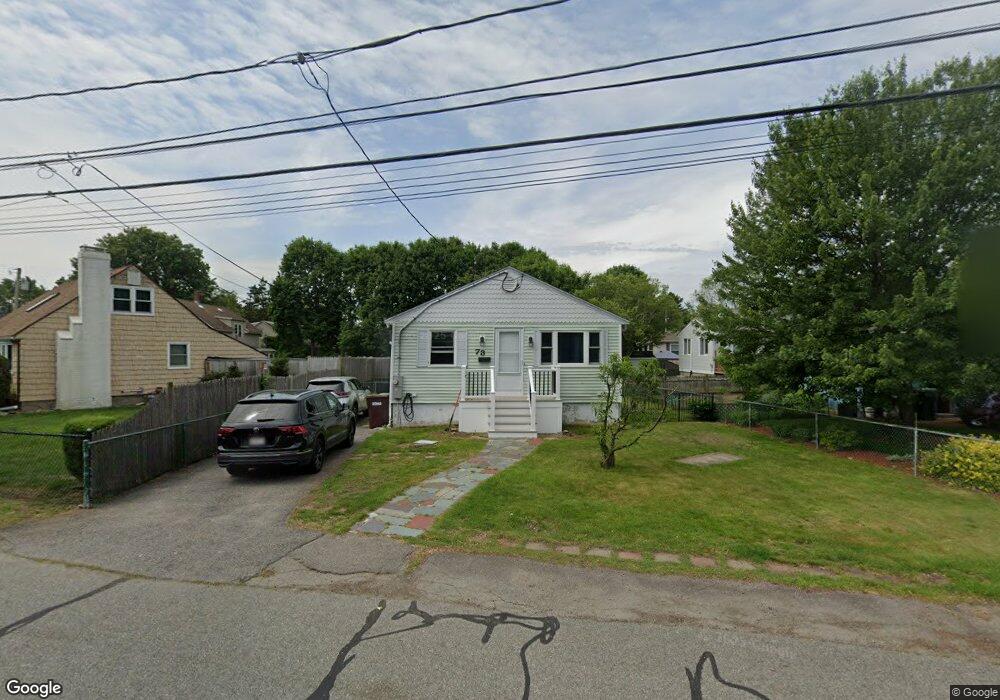
About This Home
This home is located at 73 Sherman Rd Unit 1, Dedham, MA 02026 and is currently estimated at $579,349, approximately $585 per square foot. 73 Sherman Rd Unit 1 is a home located in Norfolk County with nearby schools including Greenlodge Elementary School, Dedham Middle School, and Dedham High School.
Ownership History
We collect this data history from publicly available records. To have your information removed, we recommend requesting removal directly through your county’s website.
Purchase Details
Home Financials for this Owner
Home Financials are based on the most recent Mortgage that was taken out on this home.Purchase Details
Home Financials for this Owner
Home Financials are based on the most recent Mortgage that was taken out on this home.Purchase Details
Home Values in the Area
Average Home Value in this Area
Purchase History
We collect this data history from publicly available records. To have your information removed, we recommend requesting removal directly through your county’s website.
| Date | Buyer | Sale Price | Title Company |
|---|---|---|---|
| $330,000 | -- | ||
| $310,000 | -- | ||
| $310,000 | -- | ||
| $95,000 | -- |
Mortgage History
We collect this data history from publicly available records. To have your information removed, we recommend requesting removal directly through your county’s website.
| Date | Status | Borrower | Loan Amount |
|---|---|---|---|
| Open | $313,500 | ||
| Previous Owner | $248,000 | ||
| Previous Owner | $25,000 | ||
| Previous Owner | $10,000 |
Tax History
We collect this data history from publicly available records. To have your information removed, we recommend requesting removal directly through your county’s website.
| Year | Tax Paid | Tax Assessment Tax Assessment Total Assessment is a certain percentage of the fair market value that is determined by local assessors to be the total taxable value of land and additions on the property. | Land | Improvement |
|---|---|---|---|---|
| 2025 | $6,254 | $495,600 | $314,400 | $181,200 |
| 2024 | $5,896 | $471,700 | $285,200 | $186,500 |
| 2023 | $5,540 | $431,500 | $258,300 | $173,200 |
| 2022 | $5,249 | $393,200 | $242,500 | $150,700 |
| 2021 | $4,979 | $364,200 | $224,600 | $139,600 |
| 2020 | $5,094 | $371,300 | $224,600 | $146,700 |
| 2019 | $4,834 | $341,600 | $195,300 | $146,300 |
| 2018 | $4,494 | $308,900 | $173,500 | $135,400 |
| 2017 | $4,398 | $298,000 | $162,600 | $135,400 |
| 2016 | $4,461 | $288,000 | $150,500 | $137,500 |
| 2015 | $4,156 | $261,900 | $142,000 | $119,900 |
| 2014 | $3,970 | $246,900 | $139,400 | $107,500 |
Map
- 124 Gainsville Rd
- 130 Gainsville Rd
- 168 Crane St
- 214 Sprague St
- 93 Alden St
- 22 Azalea Cir
- 20 Bonney Ln
- 152 Sprague St
- 42 Stoughton Rd
- 24 Prescott St Unit 3
- 255 Neponset Valley Pkwy
- 18 Fales Rd
- 198 Cedar St
- 25 Cynthia Rd
- 4 Flintlock Ln
- 113 Ledgewood Rd
- 150 River St
- 121 Oakdale Ave
- 1044 East St
- 173 Jefferson St
Ask me questions while you tour the home.