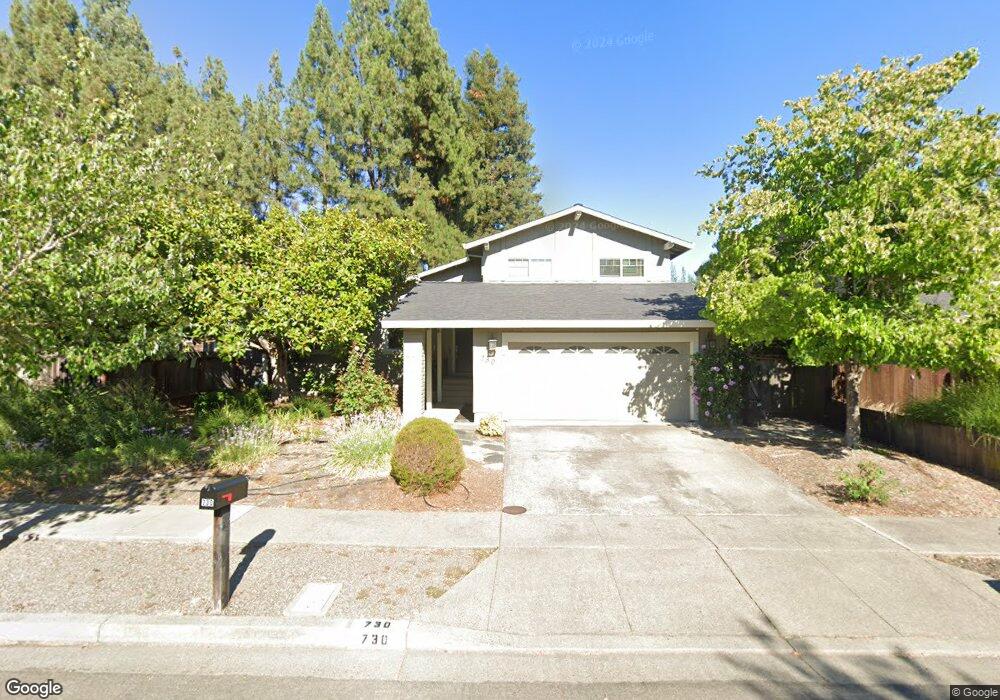
730 4th St E Sonoma, CA 95476
Estimated Value: $1,474,046 - $1,956,000
3
Beds
3
Baths
2,202
Sq Ft
$757/Sq Ft
Est. Value
About This Home
This home is located at 730 4th St E, Sonoma, CA 95476 and is currently estimated at $1,666,762, approximately $756 per square foot. 730 4th St E is a home located in Sonoma County with nearby schools including Prestwood Elementary School, Adele Harrison Middle School, and Creekside High School.
Ownership History
Date
Name
Owned For
Owner Type
Purchase Details
Closed on
Apr 13, 2024
Sold by
Powers James and Powers Molly
Bought by
Molly And James Powers Living Trust and Powers
Current Estimated Value
Purchase Details
Closed on
Aug 4, 2005
Sold by
Odonnell Eileen and Eileen Odonnell 2004 Trust
Bought by
Powers James and Powers Molly
Home Financials for this Owner
Home Financials are based on the most recent Mortgage that was taken out on this home.
Original Mortgage
$610,000
Interest Rate
5.12%
Mortgage Type
Fannie Mae Freddie Mac
Purchase Details
Closed on
Mar 18, 2004
Sold by
Odonnell Eileen and Balius Eileen M
Bought by
Odonnell Eileen and Eileen Odonnell 2004 Trust
Create a Home Valuation Report for This Property
The Home Valuation Report is an in-depth analysis detailing your home's value as well as a comparison with similar homes in the area
Home Values in the Area
Average Home Value in this Area
Purchase History
| Date | Buyer | Sale Price | Title Company |
|---|---|---|---|
| Molly And James Powers Living Trust | -- | None Listed On Document | |
| Powers James | $795,000 | Fidelity Natl Title Co | |
| Odonnell Eileen | -- | -- |
Source: Public Records
Mortgage History
| Date | Status | Borrower | Loan Amount |
|---|---|---|---|
| Previous Owner | Powers James | $610,000 |
Source: Public Records
Tax History
| Year | Tax Paid | Tax Assessment Tax Assessment Total Assessment is a certain percentage of the fair market value that is determined by local assessors to be the total taxable value of land and additions on the property. | Land | Improvement |
|---|---|---|---|---|
| 2025 | $13,487 | $1,086,421 | $478,296 | $608,125 |
| 2024 | $13,487 | $1,065,119 | $468,918 | $596,201 |
| 2023 | $13,487 | $1,044,235 | $459,724 | $584,511 |
| 2022 | $13,148 | $1,023,760 | $450,710 | $573,050 |
| 2021 | $12,864 | $1,003,687 | $441,873 | $561,814 |
| 2020 | $12,743 | $993,397 | $437,343 | $556,054 |
| 2019 | $12,459 | $973,919 | $428,768 | $545,151 |
| 2018 | $12,211 | $954,823 | $420,361 | $534,462 |
| 2017 | $11,921 | $936,102 | $412,119 | $523,983 |
| 2016 | $10,860 | $880,000 | $387,000 | $493,000 |
| 2015 | $10,077 | $822,000 | $362,000 | $460,000 |
| 2014 | $8,961 | $700,000 | $340,000 | $360,000 |
Source: Public Records
Map
Nearby Homes
- 775 4th St E
- 690 Hudson Ct
- 731 5th St E
- 670 Oak Ln
- 760 5th St E
- 637 5th St E
- 856 4th St E
- 183 France St
- 315 E Macarthur St
- 883 Cordilleras Dr
- 851 2nd St E
- 255 E Napa St
- 300 E Napa St
- 400 Eastin Dr
- 724 Charles Van Damme Way
- 151 E Napa St
- 380 Las Casitas Ct
- 5100 Lovall Valley Rd
- 649 1st St W Unit 1
- 805 1st St W Unit G
Your Personal Tour Guide
Ask me questions while you tour the home.