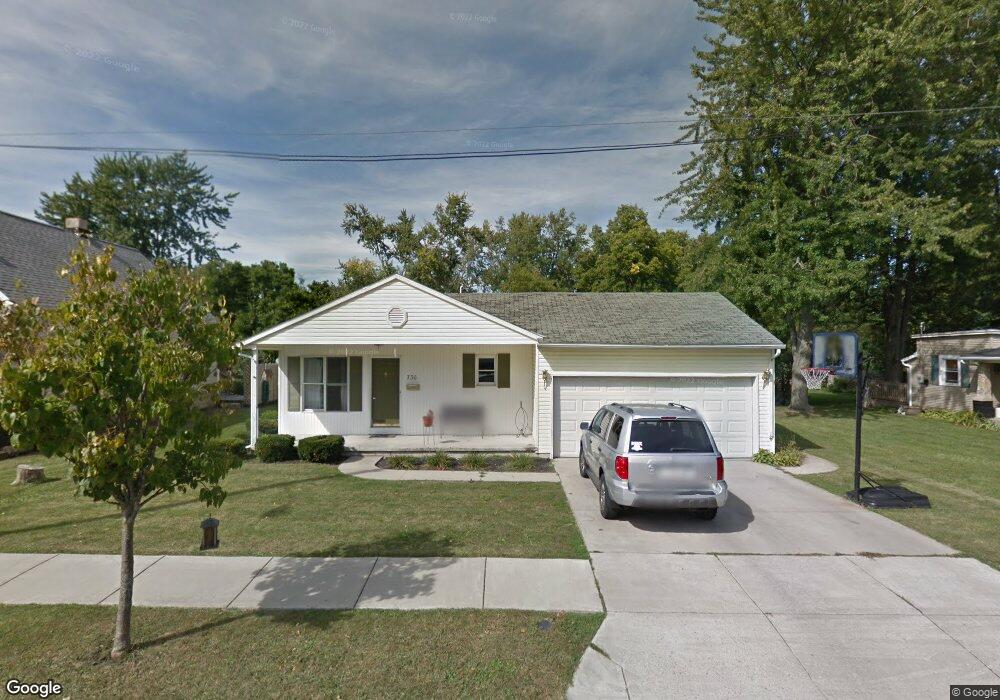
730 E Lincoln St Findlay, OH 45840
Estimated Value: $177,000 - $215,177
3
Beds
2
Baths
1,248
Sq Ft
$158/Sq Ft
Est. Value
About This Home
This home is located at 730 E Lincoln St, Findlay, OH 45840 and is currently estimated at $197,544, approximately $158 per square foot. 730 E Lincoln St is a home located in Hancock County with nearby schools including Whittier Elementary School, Wilson Vance Elementary School, and Donnell Middle School.
Ownership History
Date
Name
Owned For
Owner Type
Purchase Details
Closed on
Jul 23, 2004
Sold by
Bosworth Timothy R
Bought by
Lanagan Kenneth J and Lanagan Raquel A
Current Estimated Value
Home Financials for this Owner
Home Financials are based on the most recent Mortgage that was taken out on this home.
Original Mortgage
$109,200
Outstanding Balance
$56,083
Interest Rate
6.65%
Mortgage Type
Purchase Money Mortgage
Estimated Equity
$141,462
Purchase Details
Closed on
Jun 25, 1993
Bought by
Bosworth Timothy R
Purchase Details
Closed on
Nov 30, 1990
Bought by
Dilley Robert M and Dilley Susan L
Purchase Details
Closed on
Jan 16, 1990
Bought by
Gibson Larry
Create a Home Valuation Report for This Property
The Home Valuation Report is an in-depth analysis detailing your home's value as well as a comparison with similar homes in the area
Home Values in the Area
Average Home Value in this Area
Purchase History
| Date | Buyer | Sale Price | Title Company |
|---|---|---|---|
| Lanagan Kenneth J | $136,500 | Whitman Title | |
| Bosworth Timothy R | $69,000 | -- | |
| Dilley Robert M | $64,500 | -- | |
| Gibson Larry | $9,000 | -- |
Source: Public Records
Mortgage History
| Date | Status | Borrower | Loan Amount |
|---|---|---|---|
| Open | Lanagan Kenneth J | $109,200 | |
| Closed | Lanagan Kenneth J | $27,300 |
Source: Public Records
Tax History Compared to Growth
Tax History
| Year | Tax Paid | Tax Assessment Tax Assessment Total Assessment is a certain percentage of the fair market value that is determined by local assessors to be the total taxable value of land and additions on the property. | Land | Improvement |
|---|---|---|---|---|
| 2024 | $1,997 | $56,130 | $6,260 | $49,870 |
| 2023 | $2,000 | $56,130 | $6,260 | $49,870 |
| 2022 | $1,993 | $56,130 | $6,260 | $49,870 |
| 2021 | $1,932 | $47,400 | $6,260 | $41,140 |
| 2020 | $1,932 | $47,400 | $6,260 | $41,140 |
| 2019 | $1,893 | $47,400 | $6,260 | $41,140 |
| 2018 | $1,657 | $38,010 | $5,690 | $32,320 |
| 2017 | $828 | $38,010 | $5,690 | $32,320 |
| 2016 | $1,637 | $38,010 | $5,690 | $32,320 |
| 2015 | $1,650 | $37,650 | $5,690 | $31,960 |
| 2014 | $1,651 | $37,650 | $5,690 | $31,960 |
| 2012 | $1,639 | $37,070 | $5,690 | $31,380 |
Source: Public Records
Map
Nearby Homes
- 820 Selby St
- 15591 Canadian Way
- 15586 Canadian Way
- 15615 Canadian Way
- 904 Morse St
- 210 Eastowne Park Row
- 1001 Decker Ave
- 817 Park St
- 619 Fishlock Ave
- 1109 Brookside Dr
- 309 Huron Rd
- 545 Clinton Ct
- 1037 Fishlock Ave
- 420 1st St
- 829 Maple Ave
- 523 Center St
- 1109 Park St
- 202 Hancock St
- 1802 Lippincott Ave
- 1301 Fishlock Ave