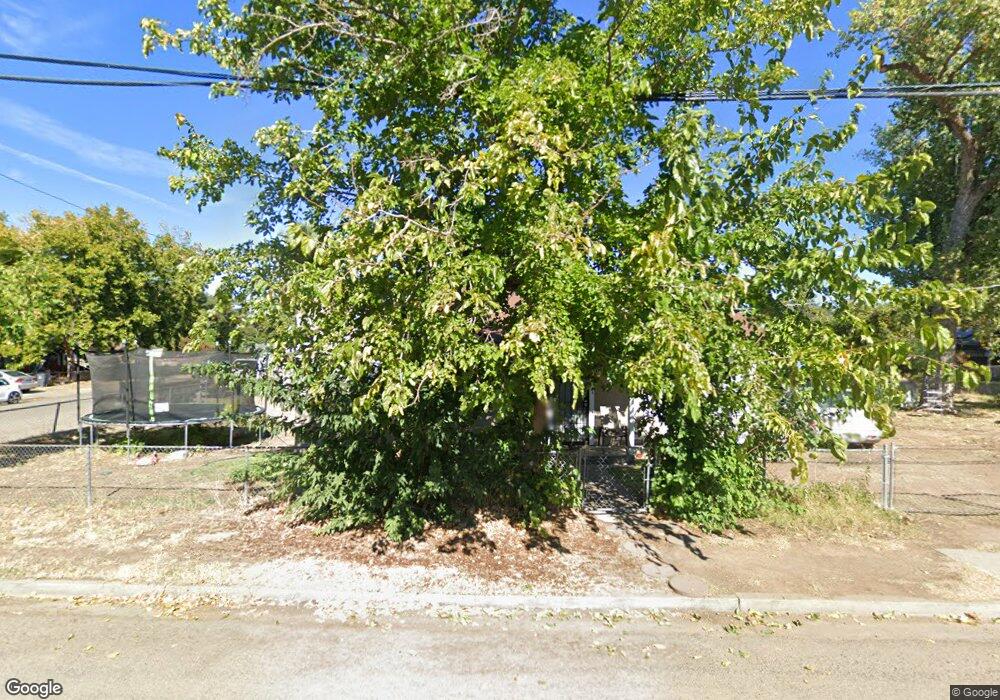
730 Lay Ave Red Bluff, CA 96080
Estimated Value: $116,399 - $258,000
2
Beds
1
Bath
1,136
Sq Ft
$150/Sq Ft
Est. Value
About This Home
This home is located at 730 Lay Ave, Red Bluff, CA 96080 and is currently estimated at $170,600, approximately $150 per square foot. 730 Lay Ave is a home located in Tehama County with nearby schools including Jackson Heights Elementary School, Vista Preparatory Academy, and Red Bluff High School.
Ownership History
Date
Name
Owned For
Owner Type
Purchase Details
Closed on
Jun 28, 2021
Sold by
Blackketter Michael A and Blackketter Janet L
Bought by
Blackketter Michael A and Blackketter Janet L
Current Estimated Value
Purchase Details
Closed on
Sep 25, 2013
Sold by
Blackketter Michael Alan and Blackketter Janet Lee
Bought by
Blackketter Michael A and Blackketter Janet L
Home Financials for this Owner
Home Financials are based on the most recent Mortgage that was taken out on this home.
Original Mortgage
$90,976
Interest Rate
4.46%
Mortgage Type
New Conventional
Create a Home Valuation Report for This Property
The Home Valuation Report is an in-depth analysis detailing your home's value as well as a comparison with similar homes in the area
Purchase History
| Date | Buyer | Sale Price | Title Company |
|---|---|---|---|
| Blackketter Michael A | -- | None Available | |
| Blackketter Michael A | -- | Placer Title Company |
Source: Public Records
Mortgage History
| Date | Status | Borrower | Loan Amount |
|---|---|---|---|
| Closed | Blackketter Michael A | $90,976 |
Source: Public Records
Tax History
| Year | Tax Paid | Tax Assessment Tax Assessment Total Assessment is a certain percentage of the fair market value that is determined by local assessors to be the total taxable value of land and additions on the property. | Land | Improvement |
|---|---|---|---|---|
| 2025 | $233 | $22,258 | $18,427 | $3,831 |
| 2023 | $229 | $21,395 | $17,712 | $3,683 |
| 2022 | $228 | $20,976 | $17,365 | $3,611 |
| 2021 | $219 | $20,566 | $17,025 | $3,541 |
| 2020 | $223 | $20,356 | $16,851 | $3,505 |
| 2019 | $225 | $19,958 | $16,521 | $3,437 |
| 2018 | $208 | $19,568 | $16,198 | $3,370 |
| 2017 | $210 | $19,185 | $15,881 | $3,304 |
| 2016 | $197 | $18,810 | $15,570 | $3,240 |
| 2015 | -- | $18,529 | $15,337 | $3,192 |
| 2014 | $191 | $18,167 | $15,037 | $3,130 |
Source: Public Records
Map
Nearby Homes
- 660 Villa Dr
- 425 S Jackson St
- 224 S Jackson St
- 406 S Jackson St
- 821 Locust St
- 910 Aloha St
- 845 Olive St
- 180 S Main St
- 1212 S Jackson St
- 1160 Orange St
- 590 Brearcliffe Dr
- 1270 Aloha St
- 524 Madison St
- 532 Madison St
- 541 Jefferson St
- 1307 Deborah Dr
- 1210 Wetter Way
- 275 Howell Ave
- 195 Howell Ave
- 728 Lincoln St
Your Personal Tour Guide
Ask me questions while you tour the home.