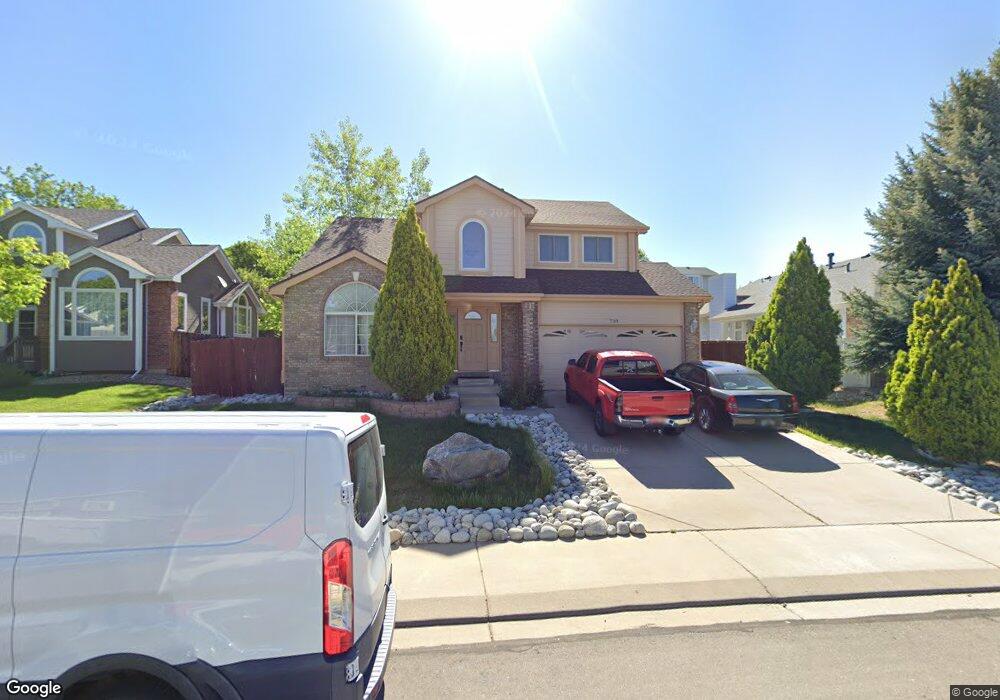
730 Megan Ct Longmont, CO 80504
Kensington NeighborhoodEstimated Value: $610,730 - $632,000
4
Beds
4
Baths
2,826
Sq Ft
$219/Sq Ft
Est. Value
About This Home
This home is located at 730 Megan Ct, Longmont, CO 80504 and is currently estimated at $618,183, approximately $218 per square foot. 730 Megan Ct is a home located in Boulder County with nearby schools including Rocky Mountain Elementary School, Trail Ridge Middle School, and Skyline High School.
Ownership History
Date
Name
Owned For
Owner Type
Purchase Details
Closed on
Jan 18, 2018
Sold by
Grandos Luis A
Bought by
Garcia Luis A Granados
Current Estimated Value
Home Financials for this Owner
Home Financials are based on the most recent Mortgage that was taken out on this home.
Original Mortgage
$316,442
Outstanding Balance
$275,437
Interest Rate
5.25%
Mortgage Type
FHA
Estimated Equity
$342,746
Purchase Details
Closed on
Feb 21, 2006
Sold by
Spencer Pamela H and Spencer Randall B
Bought by
Granados Luis A
Home Financials for this Owner
Home Financials are based on the most recent Mortgage that was taken out on this home.
Original Mortgage
$244,200
Interest Rate
8.5%
Mortgage Type
Balloon
Purchase Details
Closed on
Aug 2, 2000
Sold by
Garcia Francisco
Bought by
Spencer Randall B
Home Financials for this Owner
Home Financials are based on the most recent Mortgage that was taken out on this home.
Original Mortgage
$176,200
Interest Rate
8.21%
Purchase Details
Closed on
Mar 20, 2000
Sold by
Platte River Group Inc
Bought by
Garcia Francisco
Create a Home Valuation Report for This Property
The Home Valuation Report is an in-depth analysis detailing your home's value as well as a comparison with similar homes in the area
Home Values in the Area
Average Home Value in this Area
Purchase History
| Date | Buyer | Sale Price | Title Company |
|---|---|---|---|
| Garcia Luis A Granados | $388,000 | Heritage Title Co | |
| Granados Luis A | -- | Atgf | |
| Spencer Randall B | $195,822 | Land Title | |
| Garcia Francisco | $54,000 | Land Title |
Source: Public Records
Mortgage History
| Date | Status | Borrower | Loan Amount |
|---|---|---|---|
| Open | Garcia Luis A Granados | $316,442 | |
| Closed | Granados Luis A | $244,200 | |
| Previous Owner | Spencer Randall B | $176,200 |
Source: Public Records
Tax History Compared to Growth
Tax History
| Year | Tax Paid | Tax Assessment Tax Assessment Total Assessment is a certain percentage of the fair market value that is determined by local assessors to be the total taxable value of land and additions on the property. | Land | Improvement |
|---|---|---|---|---|
| 2025 | $3,809 | $39,932 | $10,444 | $29,488 |
| 2024 | $3,809 | $39,932 | $10,444 | $29,488 |
| 2023 | $3,758 | $39,825 | $11,457 | $32,053 |
| 2022 | $3,278 | $33,124 | $8,069 | $25,055 |
| 2021 | $3,320 | $34,077 | $8,301 | $25,776 |
| 2020 | $3,024 | $31,132 | $7,222 | $23,910 |
| 2019 | $2,976 | $31,132 | $7,222 | $23,910 |
| 2018 | $2,687 | $28,289 | $5,472 | $22,817 |
| 2017 | $2,651 | $31,275 | $6,050 | $25,225 |
| 2016 | $2,503 | $26,181 | $7,801 | $18,380 |
| 2015 | $2,385 | $22,216 | $4,935 | $17,281 |
| 2014 | $2,075 | $22,216 | $4,935 | $17,281 |
Source: Public Records
Map
Nearby Homes
- 742 Megan Ct
- 712 Pendleton Ave
- 756 Brookside Dr
- 713 Pendleton Ave
- 811 Brookside Dr
- 902 Sugar Mill Ave
- 908 Sugar Mill Ave
- 618 Silver Star Ct
- 741 Elliott St
- 575 Brookside Dr
- 1267 E 9th Ave
- 946 Granite Ct
- 12027 Saint Vrain Rd
- 448 Morgan Rd
- 1245 Trail Ridge Rd
- 829 Hubbard Dr
- 262 E 5th Ave
- 405 Elliott St
- 225 E 8th Ave Unit E20
- 225 E 8th Ave Unit A2
- 734 Megan Ct
- 726 Megan Ct
- 729 Zachary Ct
- 733 Zachary Ct
- 738 Megan Ct
- 725 Zachary Ct
- 727 Megan Ct
- 731 Megan Ct
- 737 Zachary Ct
- 735 Megan Ct
- 736 Brookside Dr
- 717 Brookside Dr
- 741 Zachary Ct
- 721 Brookside Dr
- 639 Brookside Dr
- 740 Brookside Dr
- 739 Megan Ct
- 635 Brookside Dr
- 725 Brookside Dr
- 744 Brookside Dr