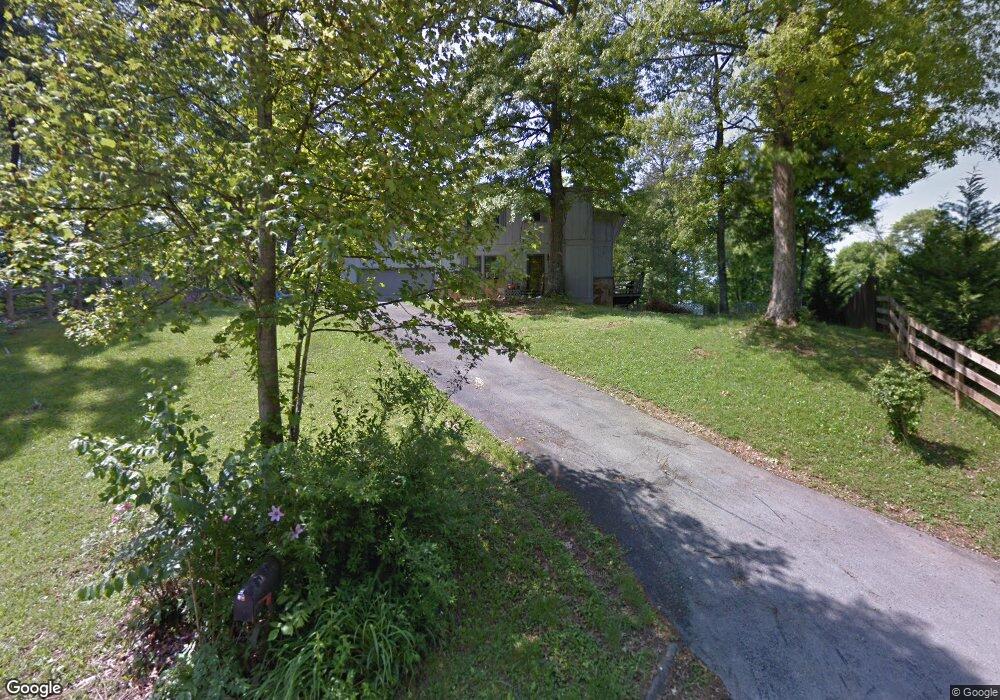
730 Oakcrest Dr Seymour, TN 37865
Estimated Value: $328,620 - $368,000
--
Bed
3
Baths
1,434
Sq Ft
$244/Sq Ft
Est. Value
About This Home
This home is located at 730 Oakcrest Dr, Seymour, TN 37865 and is currently estimated at $349,905, approximately $244 per square foot. 730 Oakcrest Dr is a home located in Blount County with nearby schools including Prospect Elementary School, Heritage Middle School, and Heritage High School.
Ownership History
Date
Name
Owned For
Owner Type
Purchase Details
Closed on
Oct 29, 2021
Sold by
Gabor Christopher J and Gabor Tabitha E
Bought by
Brandner Jesse and Brandner Amanda
Current Estimated Value
Home Financials for this Owner
Home Financials are based on the most recent Mortgage that was taken out on this home.
Original Mortgage
$236,844
Interest Rate
3.01%
Mortgage Type
New Conventional
Purchase Details
Closed on
Sep 17, 2007
Sold by
King Jason
Bought by
Gabor Christopher J
Home Financials for this Owner
Home Financials are based on the most recent Mortgage that was taken out on this home.
Original Mortgage
$151,050
Interest Rate
6.57%
Purchase Details
Closed on
Jan 25, 2006
Sold by
Hurley Dennis
Bought by
King Jason
Purchase Details
Closed on
Oct 1, 1996
Sold by
Huskey Danny L and Huskey Patricia
Bought by
Hurley Dennis
Purchase Details
Closed on
Jun 24, 1994
Bought by
Huskey Danny L and Huskey Patricia
Purchase Details
Closed on
Apr 18, 1990
Bought by
Ingle Robert Stephen and Ingle Kim
Purchase Details
Closed on
Aug 20, 1979
Bought by
Bryan William J and Bryan Joan B
Create a Home Valuation Report for This Property
The Home Valuation Report is an in-depth analysis detailing your home's value as well as a comparison with similar homes in the area
Home Values in the Area
Average Home Value in this Area
Purchase History
| Date | Buyer | Sale Price | Title Company |
|---|---|---|---|
| Brandner Jesse | -- | Amrock Llc | |
| Gabor Christopher J | $159,000 | -- | |
| King Jason | $144,000 | -- | |
| Hurley Dennis | $107,000 | -- | |
| Huskey Danny L | $95,000 | -- | |
| Ingle Robert Stephen | -- | -- | |
| Bryan William J | -- | -- |
Source: Public Records
Mortgage History
| Date | Status | Borrower | Loan Amount |
|---|---|---|---|
| Previous Owner | Brandner Jesse | $236,844 | |
| Previous Owner | Bryan William J | $151,050 |
Source: Public Records
Tax History Compared to Growth
Tax History
| Year | Tax Paid | Tax Assessment Tax Assessment Total Assessment is a certain percentage of the fair market value that is determined by local assessors to be the total taxable value of land and additions on the property. | Land | Improvement |
|---|---|---|---|---|
| 2025 | $1,299 | $81,700 | $0 | $0 |
| 2024 | $1,299 | $81,700 | $11,250 | $70,450 |
| 2023 | $1,299 | $81,700 | $11,250 | $70,450 |
| 2022 | $1,094 | $44,275 | $6,750 | $37,525 |
| 2021 | $1,094 | $44,275 | $6,750 | $37,525 |
| 2020 | $1,094 | $44,275 | $6,750 | $37,525 |
| 2019 | $1,094 | $44,275 | $6,750 | $37,525 |
| 2018 | $989 | $40,025 | $6,200 | $33,825 |
| 2017 | $989 | $40,025 | $6,200 | $33,825 |
| 2016 | $989 | $40,025 | $6,200 | $33,825 |
| 2015 | $861 | $40,025 | $6,200 | $33,825 |
| 2014 | $824 | $40,025 | $6,200 | $33,825 |
| 2013 | $824 | $38,325 | $0 | $0 |
Source: Public Records
Map
Nearby Homes
- 802 Hinkle Rd
- 634 Crestview Ct
- 830 Easey St
- 862 Hinkle Estates Dr
- 715 Winston Dr
- 827 Hinkle Estates Dr
- 516 Cherokee Hills Rd
- 0 Burns Ln
- 534 Tennessee Cir
- 516 Keck St
- 0 Miller Cir
- 372 Overlook Dr
- 401 Burns Ln
- 521 Devon St
- 139 Creekwood Way
- 1 Chapman Hwy
- 204 Joy St
- Lot 2R-1 Chapman Hwy
- Tract 1 Chapman Hwy
- 0 Chapman Hwy Unit 1287907
- 724 Oakcrest Dr
- 736 Oakcrest Dr
- 708 Water Oak Dr
- 706 Walker Ave
- 744 Oakcrest Dr
- 749 Oakcrest Dr
- 757 Oakcrest Dr
- 657 Emerald Ave
- 710 Walker Ave
- 726 Walker Ave
- 732 Walker Ave
- 711 Water Oak Dr
- 653 Emerald Ave
- 658 Water Oak Dr
- 698 Hinkle Rd
- 738 Walker Ave
- 719 Water Oak Dr
- 767 Oakcrest Dr
- 654 Emerald Ave
- 728 Water Oak Dr