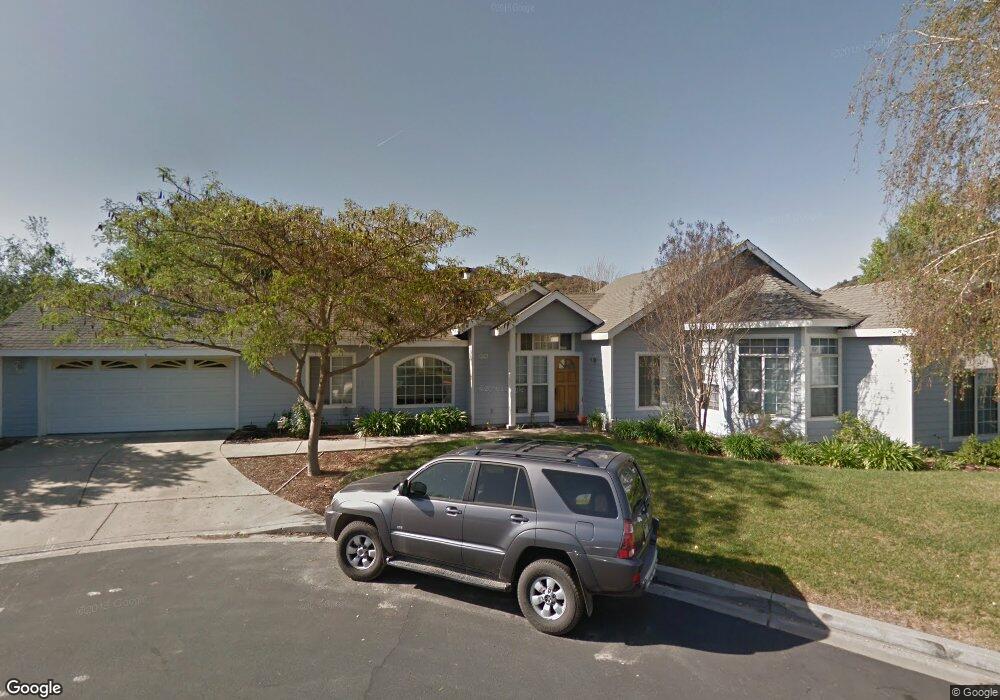
730 Shaw St Los Alamos, CA 93440
Estimated Value: $780,000 - $858,000
4
Beds
2
Baths
1,600
Sq Ft
$517/Sq Ft
Est. Value
About This Home
This home is located at 730 Shaw St, Los Alamos, CA 93440 and is currently estimated at $826,518, approximately $516 per square foot. 730 Shaw St is a home located in Santa Barbara County with nearby schools including Olga L. Reed Elementary School and Ernest Righetti High School.
Ownership History
Date
Name
Owned For
Owner Type
Purchase Details
Closed on
Dec 26, 1996
Sold by
Comanche Investments
Bought by
Bean Robert D and Bean Cynthia H
Current Estimated Value
Home Financials for this Owner
Home Financials are based on the most recent Mortgage that was taken out on this home.
Original Mortgage
$180,450
Outstanding Balance
$19,207
Interest Rate
7.53%
Estimated Equity
$807,311
Purchase Details
Closed on
Aug 13, 1996
Sold by
Bonanza Properties
Bought by
Comanche Investments
Home Financials for this Owner
Home Financials are based on the most recent Mortgage that was taken out on this home.
Original Mortgage
$132,000
Interest Rate
8.23%
Mortgage Type
Construction
Create a Home Valuation Report for This Property
The Home Valuation Report is an in-depth analysis detailing your home's value as well as a comparison with similar homes in the area
Home Values in the Area
Average Home Value in this Area
Purchase History
| Date | Buyer | Sale Price | Title Company |
|---|---|---|---|
| Bean Robert D | $190,000 | Chicago Title Co | |
| Comanche Investments | $62,000 | Chicago Title Co |
Source: Public Records
Mortgage History
| Date | Status | Borrower | Loan Amount |
|---|---|---|---|
| Open | Bean Robert D | $180,450 | |
| Previous Owner | Comanche Investments | $132,000 |
Source: Public Records
Tax History
| Year | Tax Paid | Tax Assessment Tax Assessment Total Assessment is a certain percentage of the fair market value that is determined by local assessors to be the total taxable value of land and additions on the property. | Land | Improvement |
|---|---|---|---|---|
| 2025 | $3,280 | $309,419 | $122,133 | $187,286 |
| 2023 | $3,280 | $297,406 | $117,392 | $180,014 |
| 2022 | $3,183 | $291,576 | $115,091 | $176,485 |
| 2021 | $3,110 | $285,860 | $112,835 | $173,025 |
| 2020 | $3,095 | $282,930 | $111,679 | $171,251 |
| 2019 | $3,069 | $277,384 | $109,490 | $167,894 |
| 2018 | $3,041 | $271,946 | $107,344 | $164,602 |
| 2017 | $2,918 | $266,615 | $105,240 | $161,375 |
| 2016 | $2,790 | $261,388 | $103,177 | $158,211 |
| 2014 | $2,690 | $252,421 | $99,638 | $152,783 |
Source: Public Records
Map
Nearby Homes
Your Personal Tour Guide
Ask me questions while you tour the home.