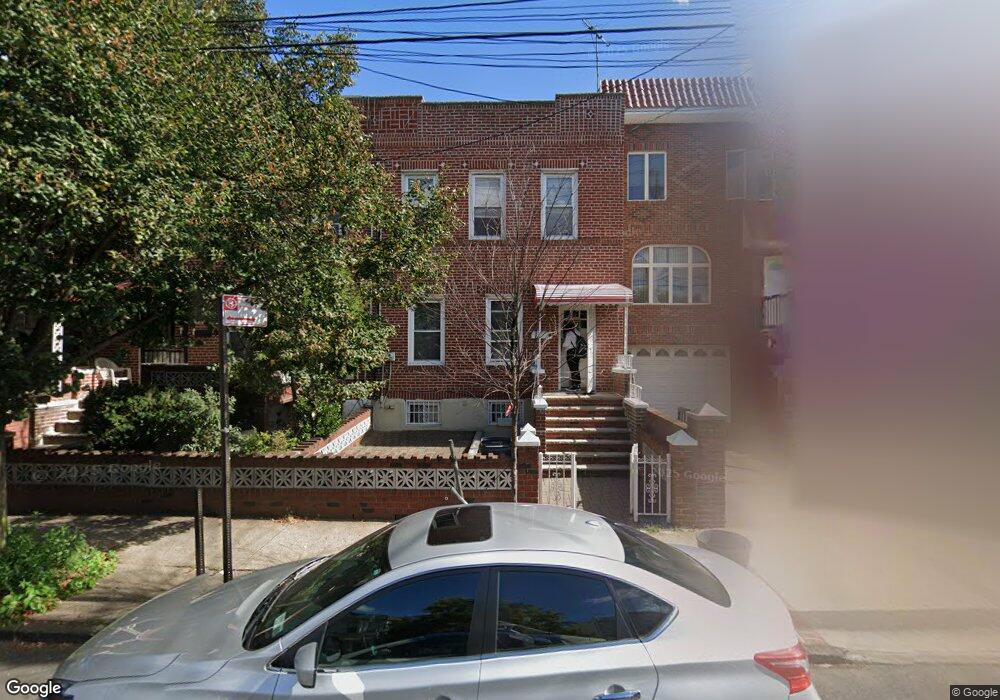
7305 11th Ave Brooklyn, NY 11228
Dyker Heights NeighborhoodEstimated Value: $1,295,000 - $1,468,000
--
Bed
--
Bath
1,800
Sq Ft
$775/Sq Ft
Est. Value
About This Home
This home is located at 7305 11th Ave, Brooklyn, NY 11228 and is currently estimated at $1,395,366, approximately $775 per square foot. 7305 11th Ave is a home located in Kings County with nearby schools including P.S. 127 McKinley Park, IS 201 Madeleine Brennan Intermediate School, and New Utrecht High School.
Ownership History
Date
Name
Owned For
Owner Type
Purchase Details
Closed on
Jul 8, 2025
Sold by
Koulentianos Quinn Irene
Bought by
Anna Koulentianos-Trimarchi As Trustee and Eleftheria Koulentianos As Trustee
Current Estimated Value
Purchase Details
Closed on
Mar 25, 2005
Sold by
Koulentianos Athanasios D and Koulentianos Irene
Bought by
Koulentianos Quinn Irene
Purchase Details
Closed on
Feb 3, 1995
Sold by
Koulentianos Athanasios D
Bought by
Koulentianos Athanasios D and Koulentianos Irene
Create a Home Valuation Report for This Property
The Home Valuation Report is an in-depth analysis detailing your home's value as well as a comparison with similar homes in the area
Home Values in the Area
Average Home Value in this Area
Purchase History
| Date | Buyer | Sale Price | Title Company |
|---|---|---|---|
| Anna Koulentianos-Trimarchi As Trustee | -- | -- | |
| Koulentianos Quinn Irene | $240,000 | -- | |
| Koulentianos Quinn Irene | $240,000 | -- | |
| Koulentianos Athanasios D | -- | First American Title Ins Co | |
| Koulentianos Athanasios D | -- | First American Title Ins Co |
Source: Public Records
Tax History Compared to Growth
Tax History
| Year | Tax Paid | Tax Assessment Tax Assessment Total Assessment is a certain percentage of the fair market value that is determined by local assessors to be the total taxable value of land and additions on the property. | Land | Improvement |
|---|---|---|---|---|
| 2025 | $8,515 | $60,600 | $20,280 | $40,320 |
| 2024 | $8,515 | $67,740 | $20,280 | $47,460 |
| 2023 | $8,500 | $74,460 | $20,280 | $54,180 |
| 2022 | $7,859 | $71,520 | $20,280 | $51,240 |
| 2021 | $8,252 | $69,300 | $20,280 | $49,020 |
| 2020 | $3,861 | $72,540 | $20,280 | $52,260 |
| 2019 | $7,341 | $65,280 | $20,280 | $45,000 |
| 2018 | $7,050 | $36,045 | $13,597 | $22,448 |
| 2017 | $6,632 | $34,006 | $12,453 | $21,553 |
| 2016 | $6,456 | $33,847 | $13,783 | $20,064 |
| 2015 | $3,650 | $31,933 | $13,994 | $17,939 |
| 2014 | $3,650 | $30,412 | $14,222 | $16,190 |
Source: Public Records
Map
Nearby Homes