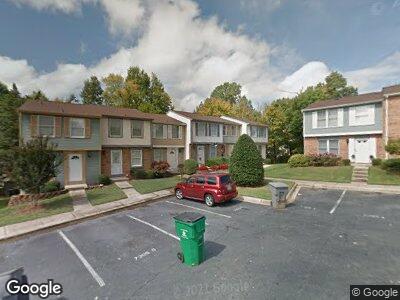
7305 Pebblestone Dr Unit B Charlotte, NC 28212
East Forest NeighborhoodEstimated Value: $198,000 - $232,000
2
Beds
2
Baths
1,230
Sq Ft
$170/Sq Ft
Est. Value
About This Home
This home is located at 7305 Pebblestone Dr Unit B, Charlotte, NC 28212 and is currently estimated at $209,059, approximately $169 per square foot. 7305 Pebblestone Dr Unit B is a home located in Mecklenburg County with nearby schools including Greenway Park Elementary, McClintock Middle School, and East Mecklenburg High.
Ownership History
Date
Name
Owned For
Owner Type
Purchase Details
Closed on
Dec 2, 2016
Sold by
Knipe Anita C
Bought by
Wallace Paul A
Current Estimated Value
Home Financials for this Owner
Home Financials are based on the most recent Mortgage that was taken out on this home.
Original Mortgage
$15,000
Outstanding Balance
$12,334
Interest Rate
3.52%
Mortgage Type
FHA
Estimated Equity
$202,281
Purchase Details
Closed on
Apr 28, 2005
Sold by
Kanipe Steven Wesley
Bought by
Kanipe Anita C
Purchase Details
Closed on
Oct 26, 1999
Sold by
Mooney Peter E
Bought by
Kanipe Anita C and Kanipe Steven Wesley
Home Financials for this Owner
Home Financials are based on the most recent Mortgage that was taken out on this home.
Original Mortgage
$70,550
Interest Rate
7.81%
Mortgage Type
Purchase Money Mortgage
Create a Home Valuation Report for This Property
The Home Valuation Report is an in-depth analysis detailing your home's value as well as a comparison with similar homes in the area
Home Values in the Area
Average Home Value in this Area
Purchase History
| Date | Buyer | Sale Price | Title Company |
|---|---|---|---|
| Wallace Paul A | $70,000 | None Available | |
| Kanipe Anita C | -- | -- | |
| Kanipe Anita C | $68,500 | -- |
Source: Public Records
Mortgage History
| Date | Status | Borrower | Loan Amount |
|---|---|---|---|
| Open | Wallace Paul A | $15,000 | |
| Previous Owner | Kanipe Steven W | $71,900 | |
| Previous Owner | Kanipe Anita C | $70,550 |
Source: Public Records
Tax History Compared to Growth
Tax History
| Year | Tax Paid | Tax Assessment Tax Assessment Total Assessment is a certain percentage of the fair market value that is determined by local assessors to be the total taxable value of land and additions on the property. | Land | Improvement |
|---|---|---|---|---|
| 2023 | $1,579 | $196,300 | $45,000 | $151,300 |
| 2022 | $892 | $79,400 | $18,000 | $61,400 |
| 2021 | $881 | $79,400 | $18,000 | $61,400 |
| 2020 | $873 | $79,400 | $18,000 | $61,400 |
| 2019 | $858 | $79,400 | $18,000 | $61,400 |
| 2018 | $664 | $45,000 | $9,600 | $35,400 |
| 2017 | $645 | $45,000 | $9,600 | $35,400 |
| 2016 | $636 | $45,000 | $9,600 | $35,400 |
| 2015 | $624 | $45,000 | $9,600 | $35,400 |
| 2014 | $617 | $50,900 | $10,800 | $40,100 |
Source: Public Records
Map
Nearby Homes
- 7309 Pebblestone Dr Unit D
- 7340 Pebblestone Dr Unit C
- 7324 Pebblestone Dr Unit E
- 7324 Pebblestone Dr Unit F
- 7445 Abigail Glen Dr
- 7122 Abbotts Glen Dr
- 7344 Pebblestone Dr Unit E
- 7719 Abigail Glen Dr
- 8149 Cedar Glen Dr
- 8175 Cedar Glen Dr
- 8103 Cedar Glen Dr
- 8069 Cedar Glen Dr Unit 8069
- 8029 Cedar Glen Dr
- 6201 Sellars Ct
- 1407 Jodhpur Ct
- 8000 Briardale Dr
- 6221 Thermal Rd
- 6227 Thermal Rd
- 6310 Welford Rd
- 2406 Brook Canyon Dr
- 7305 Pebblestone Dr
- 7305 Pebblestone Dr Unit F
- 7305 Pebblestone Dr Unit E
- 7305 Pebblestone Dr Unit D
- 7305 Pebblestone Dr Unit C
- 7305 Pebblestone Dr Unit B
- 7305 Pebblestone Dr Unit A
- 7309 Pebblestone Dr
- 7309 Pebblestone Dr Unit F
- 7309 Pebblestone Dr Unit E
- 7309 Pebblestone Dr Unit C
- 7309 Pebblestone Dr Unit B
- 7309 Pebblestone Dr Unit A
- 7301 Pebblestone Dr Unit E
- 7301 Pebblestone Dr Unit D
- 7301 Pebblestone Dr Unit C
- 7301 Pebblestone Dr Unit B
- 7301 Pebblestone Dr Unit A
- 7301 Pebblestone Dr
- 7301 Pebblestone Dr Unit 56