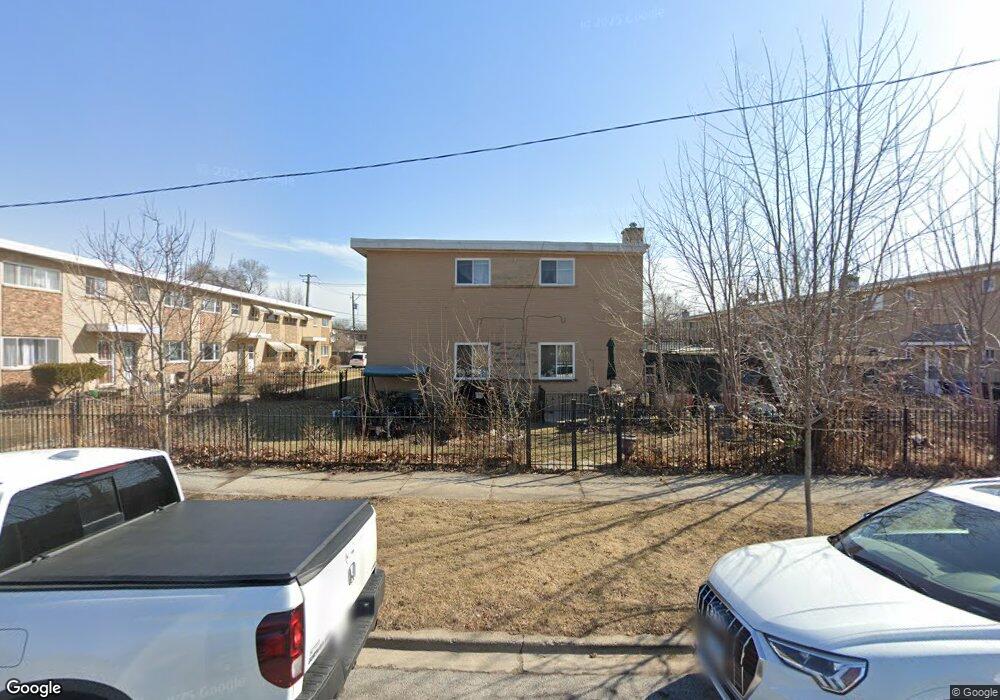
7307 N Campbell Ave Chicago, IL 60645
West Ridge NeighborhoodEstimated Value: $285,000 - $309,000
3
Beds
2
Baths
1,120
Sq Ft
$269/Sq Ft
Est. Value
About This Home
This home is located at 7307 N Campbell Ave, Chicago, IL 60645 and is currently estimated at $301,066, approximately $268 per square foot. 7307 N Campbell Ave is a home located in Cook County with nearby schools including Rogers Elementary School, Mather High School, and St Margaret Mary Elementary School.
Ownership History
Date
Name
Owned For
Owner Type
Purchase Details
Closed on
Feb 22, 2005
Sold by
Yellen Sherwin
Bought by
Seyftolooi Medhi
Current Estimated Value
Home Financials for this Owner
Home Financials are based on the most recent Mortgage that was taken out on this home.
Original Mortgage
$186,000
Outstanding Balance
$94,292
Interest Rate
5.71%
Mortgage Type
New Conventional
Estimated Equity
$206,774
Purchase Details
Closed on
Feb 18, 2005
Sold by
Chicago Title Land Trust Co
Bought by
Seyftolooi Medhi
Home Financials for this Owner
Home Financials are based on the most recent Mortgage that was taken out on this home.
Original Mortgage
$186,000
Outstanding Balance
$94,292
Interest Rate
5.71%
Mortgage Type
New Conventional
Estimated Equity
$206,774
Purchase Details
Closed on
Nov 3, 2004
Sold by
Anderson
Bought by
Yellen Sherwin and Chicago Title Land Trust Co
Create a Home Valuation Report for This Property
The Home Valuation Report is an in-depth analysis detailing your home's value as well as a comparison with similar homes in the area
Home Values in the Area
Average Home Value in this Area
Purchase History
| Date | Buyer | Sale Price | Title Company |
|---|---|---|---|
| Seyftolooi Medhi | $232,500 | Ticor Title Insurance Compan | |
| Seyftolooi Medhi | -- | Ticor | |
| Yellen Sherwin | $172,000 | -- |
Source: Public Records
Mortgage History
| Date | Status | Borrower | Loan Amount |
|---|---|---|---|
| Open | Seyftolooi Medhi | $186,000 | |
| Closed | Seyftolooi Medhi | $34,875 |
Source: Public Records
Tax History Compared to Growth
Tax History
| Year | Tax Paid | Tax Assessment Tax Assessment Total Assessment is a certain percentage of the fair market value that is determined by local assessors to be the total taxable value of land and additions on the property. | Land | Improvement |
|---|---|---|---|---|
| 2024 | $1,405 | $24,001 | $8,708 | $15,293 |
| 2023 | $1,413 | $22,000 | $6,966 | $15,034 |
| 2022 | $1,413 | $22,000 | $6,966 | $15,034 |
| 2021 | $1,345 | $22,000 | $6,966 | $15,034 |
| 2020 | $1,388 | $17,832 | $5,050 | $12,782 |
| 2019 | $3,976 | $19,792 | $5,050 | $14,742 |
| 2018 | $3,910 | $19,792 | $5,050 | $14,742 |
| 2017 | $1,459 | $14,885 | $4,527 | $10,358 |
| 2016 | $2,481 | $14,885 | $4,527 | $10,358 |
| 2015 | $2,247 | $14,885 | $4,527 | $10,358 |
| 2014 | $2,177 | $14,304 | $4,179 | $10,125 |
| 2013 | $2,123 | $14,304 | $4,179 | $10,125 |
Source: Public Records
Map
Nearby Homes
- 7249 N Campbell Ave Unit B
- 2522 W Jarvis Ave
- 2424 W Estes Ave Unit 1C
- 2424 W Estes Ave Unit 3B
- 7129 N Oakley Ave
- 7223 N Oakley Ave Unit 1E
- 7315 N Oakley Ave Unit 1A
- 2224 W Touhy Ave Unit 3N
- 2650 W Touhy Ave
- 7252 N Bell Ave
- 7433 N Washtenaw Ave
- 2175 W Touhy Ave
- 7234 N Hamilton Ave
- 2256 W Birchwood Ave
- 7344 N Ridge Blvd Unit 5C
- 7348 N Ridge Blvd Unit 16B
- 2626 W Lunt Ave
- 7546 N Oakley Ave
- 1615 W Howard St Unit 303
- 2109 W Jarvis Ave Unit 1
- 7307 N Campbell Ave
- 7307 N Campbell Ave
- 7309 N Campbell Ave
- 7301 N Campbell Ave
- 7301 N Campbell Ave
- 7313 N Campbell Ave
- 7313 N Campbell Ave
- 7313 N Campbell Ave Unit A
- 7303 N Campbell Ave
- 7303 N Campbell Ave
- 7259 N Campbell Ave
- 7259 N Campbell Ave
- 7305 N Campbell Ave
- 7305 N Campbell Ave
- 7305 N Campbell Ave Unit A
- 7315 N Campbell Ave
- 7315 N Campbell Ave
- 7315 N Campbell Ave Unit A
- 7317 N Campbell Ave
- 7317 N Campbell Ave