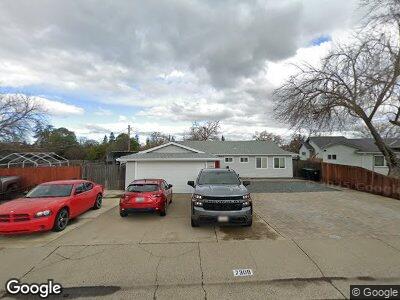
7308 Grenola Way Citrus Heights, CA 95621
Rusch Park NeighborhoodEstimated Value: $479,263 - $504,000
5
Beds
2
Baths
1,717
Sq Ft
$286/Sq Ft
Est. Value
About This Home
This home is located at 7308 Grenola Way, Citrus Heights, CA 95621 and is currently estimated at $491,066, approximately $286 per square foot. 7308 Grenola Way is a home located in Sacramento County with nearby schools including Carriage Drive Elementary School, Sylvan Middle School, and Mesa Verde High School.
Ownership History
Date
Name
Owned For
Owner Type
Purchase Details
Closed on
Feb 24, 2003
Sold by
Turner Samuel and Turner Tamela
Bought by
Crandell Scott E and Crandell Shelley R
Current Estimated Value
Home Financials for this Owner
Home Financials are based on the most recent Mortgage that was taken out on this home.
Original Mortgage
$166,000
Interest Rate
5.93%
Mortgage Type
Balloon
Purchase Details
Closed on
Nov 9, 2000
Sold by
Tejeda Ralph B and Tejeda Doris L
Bought by
Turner Samuel and Turner Tamela
Home Financials for this Owner
Home Financials are based on the most recent Mortgage that was taken out on this home.
Original Mortgage
$138,573
Interest Rate
7.86%
Create a Home Valuation Report for This Property
The Home Valuation Report is an in-depth analysis detailing your home's value as well as a comparison with similar homes in the area
Home Values in the Area
Average Home Value in this Area
Purchase History
| Date | Buyer | Sale Price | Title Company |
|---|---|---|---|
| Crandell Scott E | $207,500 | Financial Title Company | |
| Turner Samuel | $139,500 | Financial Title Company |
Source: Public Records
Mortgage History
| Date | Status | Borrower | Loan Amount |
|---|---|---|---|
| Open | Crandell Shelley R | $375,500 | |
| Closed | Crandell Shelley R | $280,145 | |
| Closed | Crandell Scott E | $240,000 | |
| Closed | Cranidell Scott E | $213,750 | |
| Closed | Crandell Scott E | $80,000 | |
| Closed | Crandell Scott E | $220,000 | |
| Closed | Crandell Scott E | $166,000 | |
| Previous Owner | Turner Samuel | $139,608 | |
| Previous Owner | Turner Samuel | $138,573 | |
| Closed | Crandell Scott E | $20,750 |
Source: Public Records
Tax History Compared to Growth
Tax History
| Year | Tax Paid | Tax Assessment Tax Assessment Total Assessment is a certain percentage of the fair market value that is determined by local assessors to be the total taxable value of land and additions on the property. | Land | Improvement |
|---|---|---|---|---|
| 2024 | $3,586 | $304,815 | $59,628 | $245,187 |
| 2023 | $3,493 | $298,839 | $58,459 | $240,380 |
| 2022 | $3,355 | $283,176 | $57,313 | $225,863 |
| 2021 | $3,298 | $277,625 | $56,190 | $221,435 |
| 2020 | $3,235 | $274,779 | $55,614 | $219,165 |
| 2019 | $3,169 | $269,392 | $54,524 | $214,868 |
| 2018 | $3,131 | $264,110 | $53,455 | $210,655 |
| 2017 | $3,098 | $258,932 | $52,407 | $206,525 |
| 2016 | $2,893 | $253,856 | $51,380 | $202,476 |
| 2015 | $2,708 | $238,551 | $48,282 | $190,269 |
| 2014 | $2,573 | $227,192 | $45,983 | $181,209 |
Source: Public Records
Map
Nearby Homes
- 7337 Brocade Dr
- 7033 Enright Dr
- 7022 Zeeland Dr
- 7044 Westchester Way
- 7105 Ansley Ct
- 7542 Pomerol Ln
- 7021 Holland Ave
- 6907 Auburn Blvd
- 6627 Creekmont Way
- 7042 van Maren Ln
- 7400 Pratt Ave
- 7744 Live Oak Way
- 77262 Lauppe Ln
- 7101 Wonner Way
- 7337 Chivalry Way
- 6821 Susanna Ct
- 77020 Lauppe Ln
- 77194 Lauppe Ln
- 77012 Lauppe Ln
- 7251 Starflower Dr
- 7308 Grenola Way
- 7304 Grenola Way
- 7314 Dovela Ct
- 7318 Dovela Ct
- 7130 Calvin Dr
- 7124 Calvin Dr
- 7300 Grenola Way
- 7136 Calvin Dr
- 7305 Grenola Way
- 7309 Grenola Way
- 7322 Dovela Ct
- 7248 Grenola Way
- 7313 Grenola Way
- 7142 Calvin Dr
- 7112 Calvin Dr
- 7241 Kersten St
- 7334 Grenola Way
- 7326 Dovela Ct
- 7244 Grenola Way