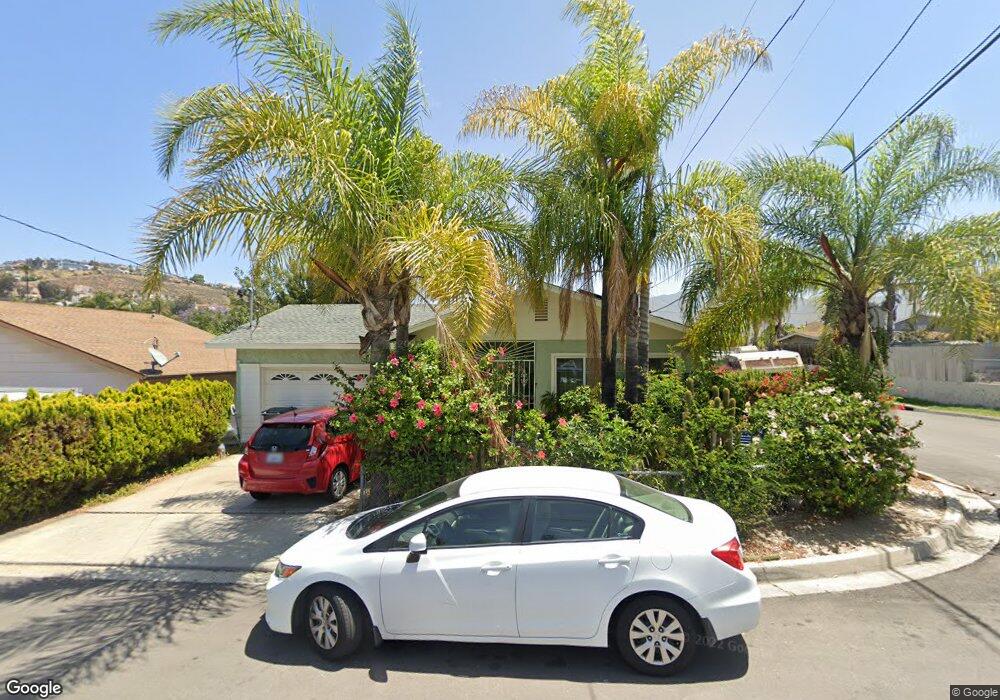
731 Pecos St Spring Valley, CA 91977
Estimated Value: $602,023 - $680,000
3
Beds
2
Baths
1,064
Sq Ft
$611/Sq Ft
Est. Value
About This Home
This home is located at 731 Pecos St, Spring Valley, CA 91977 and is currently estimated at $649,756, approximately $610 per square foot. 731 Pecos St is a home located in San Diego County with nearby schools including La Presa Elementary School, Science, Technology, Engineering, Arts, And Math Academy, and Monte Vista High School.
Ownership History
Date
Name
Owned For
Owner Type
Purchase Details
Closed on
Dec 15, 2004
Sold by
Algoso Remigio and Algoso Merly
Bought by
Algoso Remigio M and Algoso Merly
Current Estimated Value
Home Financials for this Owner
Home Financials are based on the most recent Mortgage that was taken out on this home.
Original Mortgage
$217,000
Outstanding Balance
$108,891
Interest Rate
5.76%
Mortgage Type
Stand Alone Refi Refinance Of Original Loan
Estimated Equity
$540,865
Purchase Details
Closed on
Jan 9, 1998
Sold by
Lakhwinder Singh
Bought by
Algoso Remigio and Algoso Merly
Home Financials for this Owner
Home Financials are based on the most recent Mortgage that was taken out on this home.
Original Mortgage
$118,218
Interest Rate
7.06%
Mortgage Type
VA
Purchase Details
Closed on
Oct 7, 1994
Sold by
Koszitzki Patricia Anne
Bought by
Singh Lakhwinder
Purchase Details
Closed on
Sep 21, 1989
Purchase Details
Closed on
Nov 13, 1986
Create a Home Valuation Report for This Property
The Home Valuation Report is an in-depth analysis detailing your home's value as well as a comparison with similar homes in the area
Home Values in the Area
Average Home Value in this Area
Purchase History
| Date | Buyer | Sale Price | Title Company |
|---|---|---|---|
| Algoso Remigio M | -- | First American Title Co | |
| Algoso Remigio | $116,000 | Benefit Land Title Company | |
| Singh Lakhwinder | -- | -- | |
| -- | $108,900 | -- | |
| -- | $84,000 | -- |
Source: Public Records
Mortgage History
| Date | Status | Borrower | Loan Amount |
|---|---|---|---|
| Open | Algoso Remigio M | $217,000 | |
| Previous Owner | Algoso Remigio | $118,218 |
Source: Public Records
Tax History Compared to Growth
Tax History
| Year | Tax Paid | Tax Assessment Tax Assessment Total Assessment is a certain percentage of the fair market value that is determined by local assessors to be the total taxable value of land and additions on the property. | Land | Improvement |
|---|---|---|---|---|
| 2025 | $2,701 | $185,032 | $63,853 | $121,179 |
| 2024 | $2,701 | $181,404 | $62,601 | $118,803 |
| 2023 | $2,609 | $177,848 | $61,374 | $116,474 |
| 2022 | $2,554 | $174,362 | $60,171 | $114,191 |
| 2021 | $2,533 | $170,944 | $58,992 | $111,952 |
| 2020 | $2,423 | $169,193 | $58,388 | $110,805 |
| 2019 | $2,385 | $165,877 | $57,244 | $108,633 |
| 2018 | $2,295 | $162,625 | $56,122 | $106,503 |
| 2017 | $2,222 | $159,437 | $55,022 | $104,415 |
| 2016 | $2,131 | $156,312 | $53,944 | $102,368 |
| 2015 | $2,111 | $153,965 | $53,134 | $100,831 |
| 2014 | $2,076 | $150,950 | $52,094 | $98,856 |
Source: Public Records
Map
Nearby Homes
- 9661 Saint George St
- 9693 Saint George St
- 608 San Miguel St
- 9726 Ivanho St
- 861 Paraiso Ave
- 757 Grand Ave
- 9745 Saint George St
- 935 Ramona Ave
- 0 Grand Ave Unit PW25084786
- 733 Sacramento Ave
- 444 La Presa Ave
- 9849 Saint George St Unit 18
- 0 La Mesa Ave Unit PTP2506440
- 1116 Maria Ave
- 1130 Buena Vista Ave
- 9858 Ivanho St
- 1015-17 Grand Ave
- 351 Maria Ave
- 9902 Jamacha Blvd Unit SPC 7
- 9902 Jamacha Blvd Unit 13