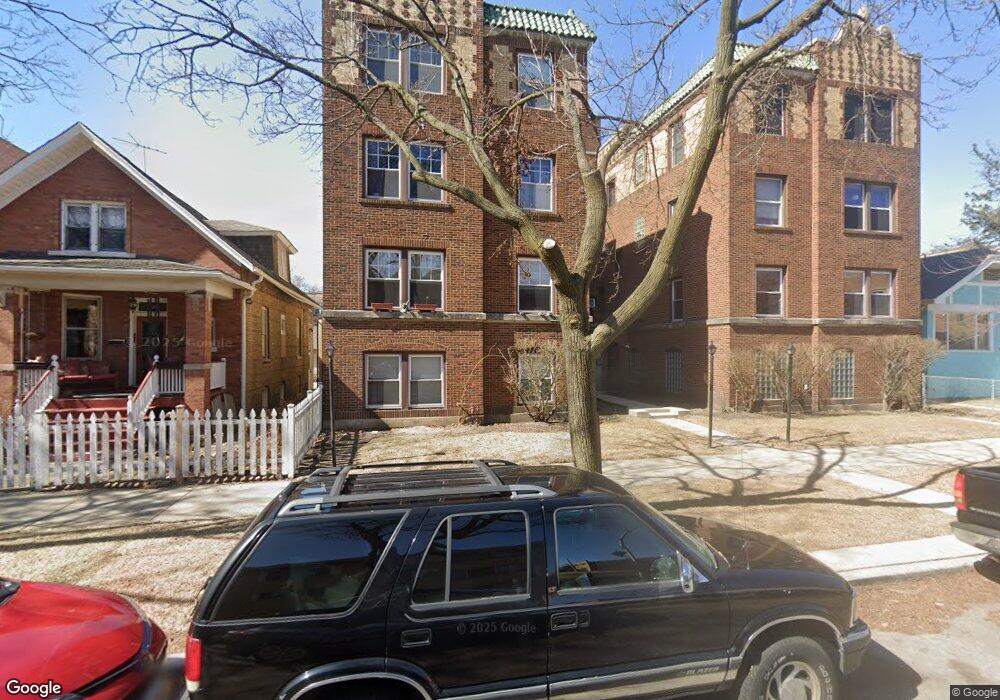
7312 N Hamilton Ave Unit 104 Chicago, IL 60645
West Ridge NeighborhoodEstimated Value: $147,000 - $156,000
1
Bed
1
Bath
660
Sq Ft
$229/Sq Ft
Est. Value
About This Home
This home is located at 7312 N Hamilton Ave Unit 104, Chicago, IL 60645 and is currently estimated at $151,027, approximately $228 per square foot. 7312 N Hamilton Ave Unit 104 is a home located in Cook County with nearby schools including George Armstrong Elementary School, Sullivan High School, and Acero - Sor Juana Ines de la Cruz School.
Ownership History
Date
Name
Owned For
Owner Type
Purchase Details
Closed on
Dec 20, 2024
Sold by
Kawano Alan J and Lamyotte Diane M
Bought by
Meyer Jorge F
Current Estimated Value
Purchase Details
Closed on
Aug 28, 2014
Sold by
Kawano Alan J
Bought by
Lamyotte Diane M and Kawano Alan J
Purchase Details
Closed on
Oct 5, 1998
Sold by
Hudson Paschal Debra
Bought by
Kawano Alan J
Home Financials for this Owner
Home Financials are based on the most recent Mortgage that was taken out on this home.
Original Mortgage
$54,350
Interest Rate
6.9%
Purchase Details
Closed on
Jul 31, 1995
Sold by
Rutiezer Steven
Bought by
Hudson Paschal Debra
Home Financials for this Owner
Home Financials are based on the most recent Mortgage that was taken out on this home.
Original Mortgage
$45,100
Interest Rate
7.51%
Create a Home Valuation Report for This Property
The Home Valuation Report is an in-depth analysis detailing your home's value as well as a comparison with similar homes in the area
Home Values in the Area
Average Home Value in this Area
Purchase History
| Date | Buyer | Sale Price | Title Company |
|---|---|---|---|
| Meyer Jorge F | $149,000 | None Listed On Document | |
| Lamyotte Diane M | -- | None Available | |
| Kawano Alan J | $60,500 | -- | |
| Hudson Paschal Debra | -- | Chicago Title Insurance Co |
Source: Public Records
Mortgage History
| Date | Status | Borrower | Loan Amount |
|---|---|---|---|
| Previous Owner | Kawano Alan J | $54,350 | |
| Previous Owner | Hudson Paschal Debra | $45,100 |
Source: Public Records
Tax History Compared to Growth
Tax History
| Year | Tax Paid | Tax Assessment Tax Assessment Total Assessment is a certain percentage of the fair market value that is determined by local assessors to be the total taxable value of land and additions on the property. | Land | Improvement |
|---|---|---|---|---|
| 2024 | $112 | $11,533 | $1,429 | $10,104 |
| 2023 | $70 | $6,500 | $1,143 | $5,357 |
| 2022 | $70 | $6,500 | $1,143 | $5,357 |
| 2021 | $101 | $6,498 | $1,142 | $5,356 |
| 2020 | $124 | $6,141 | $1,079 | $5,062 |
| 2019 | $129 | $6,813 | $1,079 | $5,734 |
| 2018 | $124 | $6,813 | $1,079 | $5,734 |
| 2017 | $0 | $5,886 | $952 | $4,934 |
| 2016 | $372 | $4,596 | $952 | $3,644 |
| 2015 | $968 | $7,906 | $952 | $6,954 |
| 2014 | $597 | $5,787 | $857 | $4,930 |
| 2013 | $574 | $5,787 | $857 | $4,930 |
Source: Public Records
Map
Nearby Homes
- 7344 N Ridge Blvd Unit 5C
- 7348 N Ridge Blvd Unit 16B
- 7234 N Hamilton Ave
- 7315 N Oakley Ave Unit 1A
- 2109 W Jarvis Ave Unit 1
- 7223 N Oakley Ave Unit 1E
- 2224 W Touhy Ave Unit 3N
- 2044 W Jarvis Ave Unit 3G
- 2038 W Jarvis Ave Unit 20382D
- 2038 W Jarvis Ave Unit 2F
- 2175 W Touhy Ave
- 7228 N Rogers Ave
- 7129 N Oakley Ave
- 2256 W Birchwood Ave
- 7323 N Damen Ave
- 7074 N Ridge Blvd Unit 1E
- 7227 N Damen Ave
- 7223 N Damen Ave
- 7070 N Ridge Blvd Unit 1A
- 7207 N Damen Ave Unit 2
- 7312 N Hamilton Ave Unit 103
- 7312 N Hamilton Ave Unit 304
- 7312 N Hamilton Ave Unit 303
- 7312 N Hamilton Ave Unit 203
- 7312 N Hamilton Ave Unit 1W
- 7312 N Hamilton Ave Unit 3E
- 7312 N Hamilton Ave Unit 204
- 7312 N Hamilton Ave Unit 3W
- 7318 N Hamilton Ave
- 7310 N Hamilton Ave Unit 7310G
- 7310 N Hamilton Ave Unit P5
- 7310 N Hamilton Ave Unit 302
- 7310 N Hamilton Ave Unit 301
- 7310 N Hamilton Ave Unit P4
- 7310 N Hamilton Ave Unit P6
- 7310 N Hamilton Ave Unit 1P
- 7310 N Hamilton Ave Unit 204
- 7310 N Hamilton Ave Unit 202
- 7310 N Hamilton Ave Unit 102
- 7310 N Hamilton Ave Unit 3P