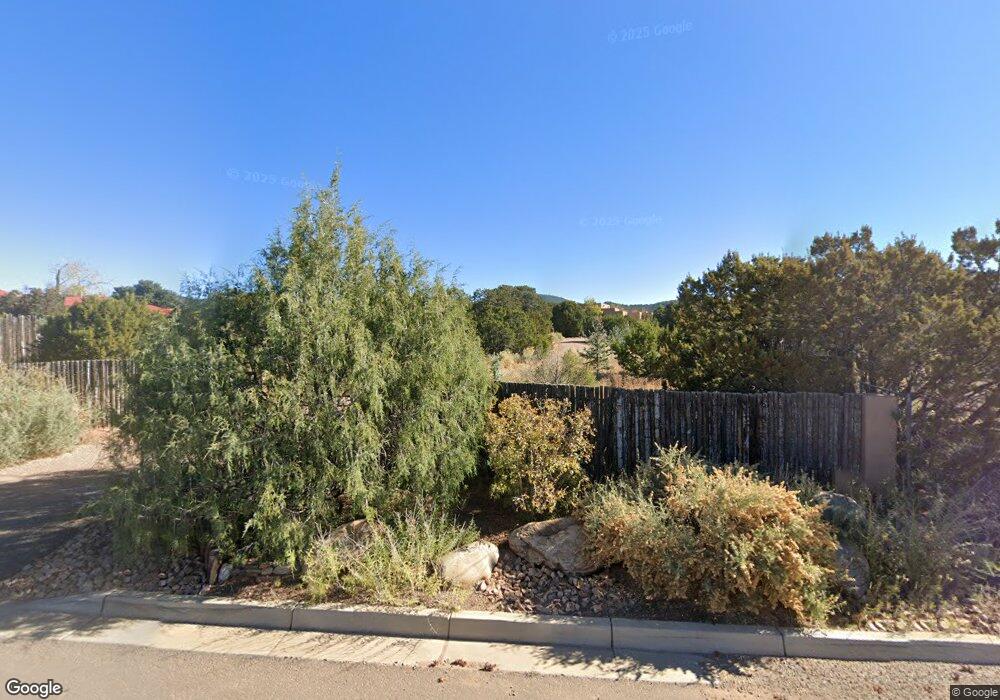
7317 Old Santa fe Trail Unit C Santa Fe, NM 87505
Old Las Vegas Corridor NeighborhoodEstimated Value: $1,420,000 - $2,686,097
2
Beds
4
Baths
4,445
Sq Ft
$443/Sq Ft
Est. Value
About This Home
This home is located at 7317 Old Santa fe Trail Unit C, Santa Fe, NM 87505 and is currently estimated at $1,967,524, approximately $442 per square foot. 7317 Old Santa fe Trail Unit C is a home located in Santa Fe County with nearby schools including Wood-Gormley Elementary School, Santa Fe High School, and Thrive Community School.
Ownership History
Date
Name
Owned For
Owner Type
Purchase Details
Closed on
Jul 21, 2017
Sold by
Lockwood Robert E
Bought by
Caire Arthur A and Caire Aryan
Current Estimated Value
Home Financials for this Owner
Home Financials are based on the most recent Mortgage that was taken out on this home.
Original Mortgage
$1,000,000
Outstanding Balance
$831,287
Interest Rate
3.91%
Mortgage Type
New Conventional
Estimated Equity
$1,136,237
Purchase Details
Closed on
Aug 23, 2006
Sold by
Lockwood Development Co Llc
Bought by
Lockwood Robert E and Lockwood Jenny Y
Home Financials for this Owner
Home Financials are based on the most recent Mortgage that was taken out on this home.
Original Mortgage
$735,000
Interest Rate
6.72%
Mortgage Type
Construction
Purchase Details
Closed on
Mar 14, 2006
Sold by
Lockwood Development Co Llc
Bought by
Lockwood Robert E and Lockwood Jenny
Create a Home Valuation Report for This Property
The Home Valuation Report is an in-depth analysis detailing your home's value as well as a comparison with similar homes in the area
Home Values in the Area
Average Home Value in this Area
Purchase History
| Date | Buyer | Sale Price | Title Company |
|---|---|---|---|
| Caire Arthur A | -- | Santa Fem Title | |
| Lockwood Robert E | -- | Title Guaranty & Ins Co | |
| Lockwood Robert E | -- | Ccts |
Source: Public Records
Mortgage History
| Date | Status | Borrower | Loan Amount |
|---|---|---|---|
| Open | Caire Arthur A | $1,000,000 | |
| Previous Owner | Lockwood Robert E | $735,000 |
Source: Public Records
Tax History Compared to Growth
Tax History
| Year | Tax Paid | Tax Assessment Tax Assessment Total Assessment is a certain percentage of the fair market value that is determined by local assessors to be the total taxable value of land and additions on the property. | Land | Improvement |
|---|---|---|---|---|
| 2024 | $10,296 | $1,472,022 | $127,657 | $1,344,365 |
| 2023 | $10,307 | $1,429,148 | $123,939 | $1,305,209 |
| 2022 | $10,045 | $1,387,524 | $120,330 | $1,267,194 |
| 2021 | $8,347 | $380,463 | $33,433 | $347,030 |
| 2020 | $8,503 | $384,801 | $30,099 | $354,702 |
| 2019 | $8,336 | $373,593 | $30,099 | $343,494 |
| 2018 | $8,119 | $362,712 | $30,099 | $332,613 |
| 2017 | $5,387 | $243,934 | $30,099 | $213,835 |
| 2016 | $5,432 | $254,277 | $67,000 | $187,277 |
| 2015 | $6,024 | $278,990 | $67,000 | $211,990 |
| 2014 | $6,602 | $312,947 | $66,933 | $246,014 |
Source: Public Records
Map
Nearby Homes
- 17 Sueno de Santa Fe
- 15 Toltec Rd
- 7 La Vista
- 2 Toltec Rd
- 3758 Valmora Rd
- 109 Coyote Mountain Rd
- 103 Coyote Mountain Rd
- 24 Old Agua Fria Rd W
- 117 La Ventana
- 12 Old Agua Fria Rd E
- 106 La Ventana Dr
- 29 La Barbaria Rd
- 205 Double Arrow Rd Unit A
- 6 Overlook Rd
- 3101 Old Pecos Trail Unit 314
- 3101 Old Pecos Trail Unit 675
- 3101 Old Pecos Trail Unit 412
- 3101 Old Pecos Trail Unit 414
- 3101 Old Pecos Trail Unit 692
- 3101 Old Pecos Trail Unit 632
- 7317 Old Santa fe Trail Unit A
- 7317 Old Santa fe Trail Unit B
- 7317 Old Santa fe Trail
- 7317A Old Santa fe Trail Unit A
- 7317A Old Santa fe Trail
- 7317A Old Santa fe Trail Unit A
- 19 Pinon Jay Trail
- 19-A & B Pinon Jay
- 13 Pinon Jay Trail
- 7317B Old Santa fe Trail
- 18 Pinon Jay Trail
- 7317C Old Santa fe Trail
- 7317C Old Santa fe Trail
- 31 Pinon Jay Trail
- 20 Star Vista Rd
- 20 Star Vista Rd Unit 1
- 7325 Old Santa fe Trail Unit B
- 7325 Old Santa fe Trail Unit A
- 7325 Old Santa fe Trail
- 7315 Old Santa fe Trail