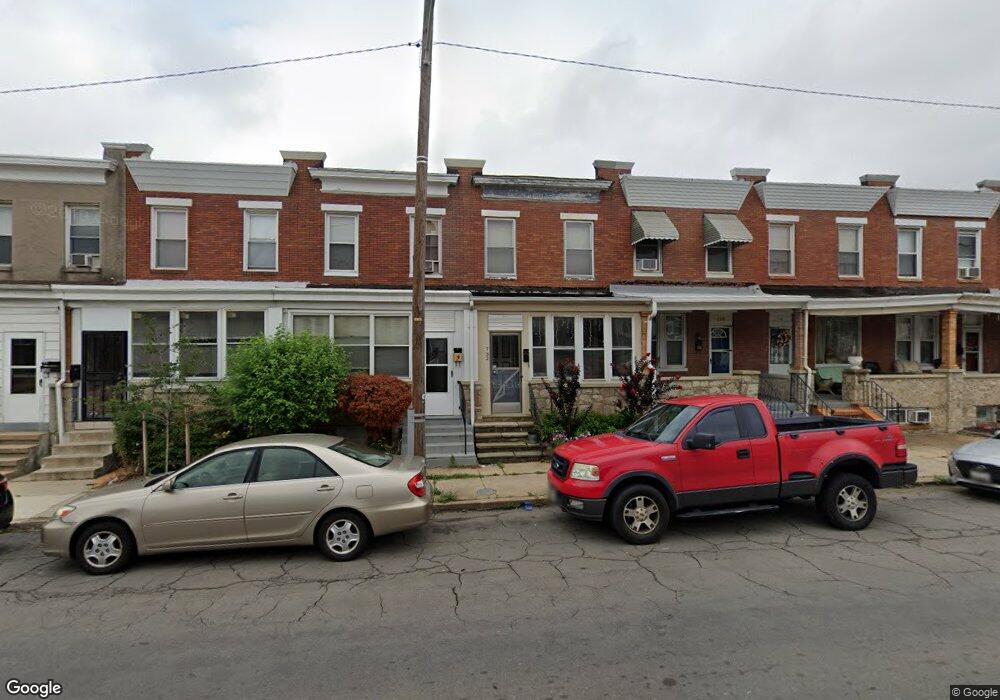
732 Oldham St Baltimore, MD 21224
Greektown NeighborhoodEstimated Value: $246,000 - $273,562
Studio
1
Bath
1,178
Sq Ft
$221/Sq Ft
Est. Value
About This Home
This home is located at 732 Oldham St, Baltimore, MD 21224 and is currently estimated at $259,781, approximately $220 per square foot. 732 Oldham St is a home located in Baltimore City with nearby schools including John Ruhrah Elementary School, Booker T. Washington Middle School, and Patterson High School.
Ownership History
Date
Name
Owned For
Owner Type
Purchase Details
Closed on
Nov 22, 2000
Sold by
Contimortgage Corporation
Bought by
Lessner David A
Current Estimated Value
Purchase Details
Closed on
Jun 5, 2000
Sold by
Vonnordeck Godfrey C
Bought by
Conti Mortgage Corp
Purchase Details
Closed on
May 24, 1999
Sold by
Innercoastal Properties
Bought by
Vonnordeck Godfrey C and Von Nordeck Maria
Purchase Details
Closed on
Jun 23, 1998
Sold by
Hammond Thomas R
Bought by
Secretary Of Housing and Urban Development
Purchase Details
Closed on
Mar 30, 1995
Sold by
Spinnato Frances
Bought by
Hammond Thomas R
Home Financials for this Owner
Home Financials are based on the most recent Mortgage that was taken out on this home.
Original Mortgage
$48,159
Interest Rate
8.8%
Create a Home Valuation Report for This Property
The Home Valuation Report is an in-depth analysis detailing your home's value as well as a comparison with similar homes in the area
Home Values in the Area
Average Home Value in this Area
Purchase History
| Date | Buyer | Sale Price | Title Company |
|---|---|---|---|
| Lessner David A | $42,400 | -- | |
| Conti Mortgage Corp | $40,000 | -- | |
| Vonnordeck Godfrey C | $62,500 | -- | |
| Innercoastal Properties | $28,700 | -- | |
| Secretary Of Housing | $58,336 | -- | |
| Hammond Thomas R | $47,700 | -- |
Source: Public Records
Mortgage History
| Date | Status | Borrower | Loan Amount |
|---|---|---|---|
| Previous Owner | Hammond Thomas R | $48,159 |
Source: Public Records
Tax History
| Year | Tax Paid | Tax Assessment Tax Assessment Total Assessment is a certain percentage of the fair market value that is determined by local assessors to be the total taxable value of land and additions on the property. | Land | Improvement |
|---|---|---|---|---|
| 2025 | $2,718 | $182,100 | $90,000 | $92,100 |
| 2024 | $2,718 | $175,200 | -- | -- |
| 2023 | $2,596 | $168,300 | $0 | $0 |
| 2022 | $2,547 | $161,400 | $90,000 | $71,400 |
| 2021 | $3,809 | $161,400 | $90,000 | $71,400 |
| 2020 | $2,350 | $161,400 | $90,000 | $71,400 |
| 2019 | $2,242 | $164,200 | $90,000 | $74,200 |
| 2018 | $2,178 | $153,000 | $0 | $0 |
| 2017 | $2,105 | $141,800 | $0 | $0 |
| 2016 | $1,777 | $130,600 | $0 | $0 |
| 2015 | $1,777 | $127,667 | $0 | $0 |
| 2014 | $1,777 | $124,733 | $0 | $0 |
Source: Public Records
Map
Nearby Homes
Your Personal Tour Guide
Ask me questions while you tour the home.