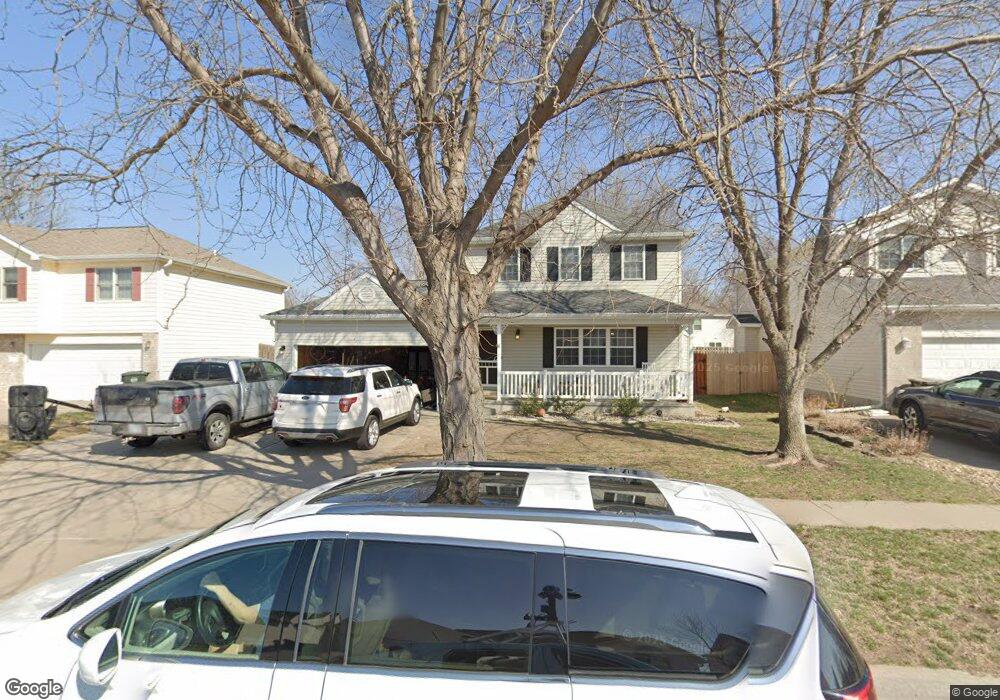
7320 Nolan Rd Lincoln, NE 68512
Vavrina Meadows NeighborhoodEstimated Value: $366,471 - $424,000
4
Beds
4
Baths
2,200
Sq Ft
$177/Sq Ft
Est. Value
About This Home
This home is located at 7320 Nolan Rd, Lincoln, NE 68512 and is currently estimated at $389,618, approximately $177 per square foot. 7320 Nolan Rd is a home located in Lancaster County with nearby schools including Adams Elementary School, Scott Middle School, and Southwest High School.
Ownership History
Date
Name
Owned For
Owner Type
Purchase Details
Closed on
Dec 22, 2020
Sold by
Jarecke Timothy E and Jarecke Michelle L
Bought by
Ponce Properties Llc
Current Estimated Value
Home Financials for this Owner
Home Financials are based on the most recent Mortgage that was taken out on this home.
Original Mortgage
$246,500
Outstanding Balance
$219,459
Interest Rate
2.7%
Mortgage Type
Future Advance Clause Open End Mortgage
Estimated Equity
$170,159
Purchase Details
Closed on
Mar 13, 2002
Sold by
Apthorpe Kent F and Apthorpe Margaret A
Bought by
Jarecke Timothy E and Jarecke Michelle I
Home Financials for this Owner
Home Financials are based on the most recent Mortgage that was taken out on this home.
Original Mortgage
$120,000
Interest Rate
7.01%
Purchase Details
Closed on
Sep 25, 2001
Sold by
R C Krueger Development Co Inc
Bought by
Apthorpe Kent F
Create a Home Valuation Report for This Property
The Home Valuation Report is an in-depth analysis detailing your home's value as well as a comparison with similar homes in the area
Home Values in the Area
Average Home Value in this Area
Purchase History
| Date | Buyer | Sale Price | Title Company |
|---|---|---|---|
| Ponce Properties Llc | $280,000 | Union Title Company Llc | |
| Jarecke Timothy E | $155,000 | -- | |
| Apthorpe Kent F | $32,000 | -- |
Source: Public Records
Mortgage History
| Date | Status | Borrower | Loan Amount |
|---|---|---|---|
| Open | Ponce Properties Llc | $246,500 | |
| Previous Owner | Jarecke Timothy E | $120,000 |
Source: Public Records
Tax History Compared to Growth
Tax History
| Year | Tax Paid | Tax Assessment Tax Assessment Total Assessment is a certain percentage of the fair market value that is determined by local assessors to be the total taxable value of land and additions on the property. | Land | Improvement |
|---|---|---|---|---|
| 2025 | $4,531 | $347,600 | $65,000 | $282,600 |
| 2024 | $4,531 | $324,800 | $65,000 | $259,800 |
| 2023 | $5,175 | $308,800 | $65,000 | $243,800 |
| 2022 | $5,046 | $253,200 | $50,000 | $203,200 |
| 2021 | $4,774 | $253,200 | $50,000 | $203,200 |
| 2020 | $4,448 | $232,800 | $50,000 | $182,800 |
| 2019 | $4,449 | $232,800 | $50,000 | $182,800 |
| 2018 | $4,173 | $217,400 | $50,000 | $167,400 |
| 2017 | $4,211 | $217,400 | $50,000 | $167,400 |
| 2016 | $3,908 | $200,700 | $45,000 | $155,700 |
| 2015 | $3,881 | $200,700 | $45,000 | $155,700 |
| 2014 | $3,606 | $185,400 | $40,000 | $145,400 |
| 2013 | -- | $185,400 | $40,000 | $145,400 |
Source: Public Records
Map
Nearby Homes
- 7431 Nolan Rd
- 2101 Herel St
- 7441 S 19th St
- 1721 Vavrina Ln
- 1800 Chloe Ln
- 7930 S 20th St
- 1901 Hidden Pines Dr
- 1800 Miranda Ct
- 2236 Scotch Pine Trail
- 6851 Shadow Ridge Rd
- 6725 S Ridge Dr
- 7700 S 26th St
- 7820 S 26th St
- 6521 S 21st St
- 8005 Laytonjohn Ln
- 6528 Lone Tree Dr
- 7740 O'Rourke Dr
- 2515 Ridge Rd
- 6419 Lone Tree Dr
- 6418 Lone Tree Dr