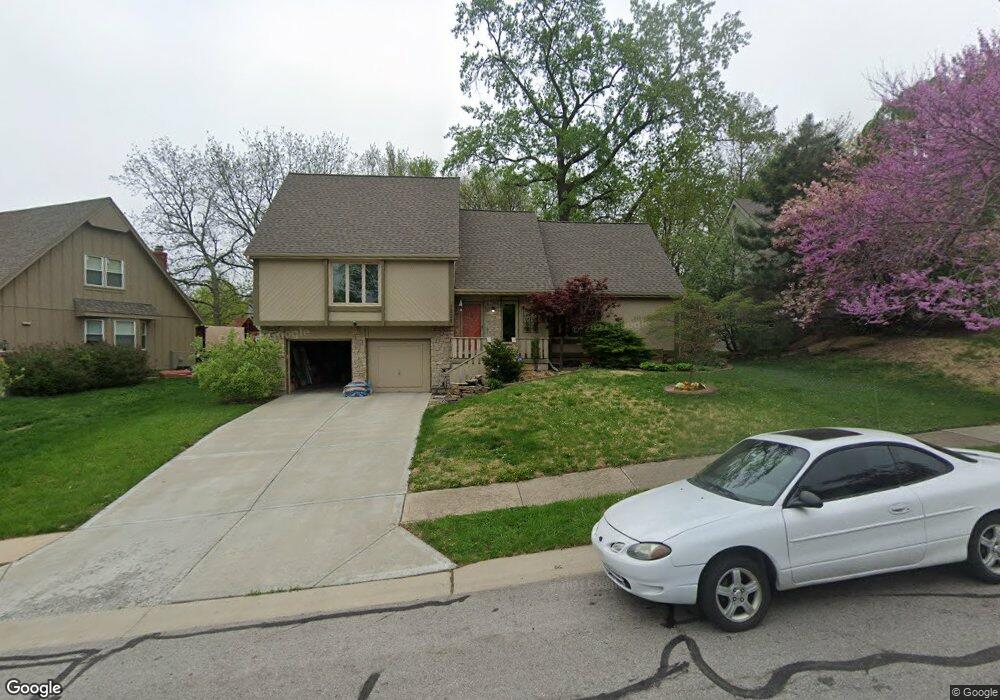
7325 Charles Ct Shawnee, KS 66216
Estimated Value: $376,000 - $514,000
3
Beds
2
Baths
2,004
Sq Ft
$210/Sq Ft
Est. Value
About This Home
This home is located at 7325 Charles Ct, Shawnee, KS 66216 and is currently estimated at $421,753, approximately $210 per square foot. 7325 Charles Ct is a home located in Johnson County with nearby schools including Mill Creek Elementary School, Trailridge Middle School, and Shawnee Mission Northwest High School.
Ownership History
Date
Name
Owned For
Owner Type
Purchase Details
Closed on
Sep 23, 2024
Sold by
Schmitz Joseph D and Schmitz Teresa
Bought by
Joseph And Teresa Schmitz Living Trust and Schmitz
Current Estimated Value
Purchase Details
Closed on
Sep 28, 2020
Sold by
Schmitz Joe and Schmitz Teresa
Bought by
Schmitz Joseph D and Schmitz Teresa
Home Financials for this Owner
Home Financials are based on the most recent Mortgage that was taken out on this home.
Original Mortgage
$97,000
Interest Rate
2.71%
Mortgage Type
New Conventional
Create a Home Valuation Report for This Property
The Home Valuation Report is an in-depth analysis detailing your home's value as well as a comparison with similar homes in the area
Home Values in the Area
Average Home Value in this Area
Purchase History
| Date | Buyer | Sale Price | Title Company |
|---|---|---|---|
| Joseph And Teresa Schmitz Living Trust | -- | None Listed On Document | |
| Schmitz Joseph D | -- | First American Title |
Source: Public Records
Mortgage History
| Date | Status | Borrower | Loan Amount |
|---|---|---|---|
| Previous Owner | Schmitz Joseph D | $97,000 |
Source: Public Records
Tax History Compared to Growth
Tax History
| Year | Tax Paid | Tax Assessment Tax Assessment Total Assessment is a certain percentage of the fair market value that is determined by local assessors to be the total taxable value of land and additions on the property. | Land | Improvement |
|---|---|---|---|---|
| 2024 | $4,145 | $39,192 | $7,926 | $31,266 |
| 2023 | $3,994 | $37,260 | $7,926 | $29,334 |
| 2022 | $3,548 | $32,993 | $6,887 | $26,106 |
| 2021 | $3,612 | $31,498 | $6,258 | $25,240 |
| 2020 | $3,371 | $29,003 | $5,691 | $23,312 |
| 2019 | $3,101 | $26,645 | $4,701 | $21,944 |
| 2018 | $3,014 | $25,794 | $4,701 | $21,093 |
| 2017 | $2,849 | $24,000 | $4,088 | $19,912 |
| 2016 | $2,702 | $22,459 | $4,088 | $18,371 |
| 2015 | $2,441 | $21,103 | $4,086 | $17,017 |
| 2013 | -- | $19,677 | $4,086 | $15,591 |
Source: Public Records
Map
Nearby Homes
- 12403 W 72nd Terrace
- 7502 Monrovia St
- 7526 Monrovia St
- 7130 Westgate St
- 7107 Garnett St
- Augusta Plan at Kenneth Estates
- Newport Plan at Kenneth Estates
- Rosemount II Plan at Kenneth Estates
- The Avala Villa Plan at Kenneth Estates
- The Rosemount Villa Plan at Kenneth Estates
- Catalina II Plan at Kenneth Estates
- The Avala Plan at Kenneth Estates
- 12811 W 71st St
- 7115 Richards Dr
- 13100 W 72nd St
- 7105 Richards Dr
- 11406 W 71st St
- 7736 Westgate Dr
- 7805 Long Ave
- 7812 Caenen St
- 7329 Charles Ct
- 12125 W 73rd Terrace
- 7306 Charles St
- 7333 Charles Ct
- 7310 Charles St
- 7302 Charles St
- 7324 Charles Ct
- 7314 Charles St
- 7328 Charles Ct
- 7337 Charles Ct
- 7334 Charles Ct
- 7318 Charles St
- 12200 W 73rd Terrace
- 12128 W 73rd Terrace
- 12124 W 73rd Terrace
- 12204 W 73rd Terrace
- 12122 W 73rd Terrace
- 7338 Charles Ct
- 12208 W 73rd Terrace
- 12120 W 73rd Terrace