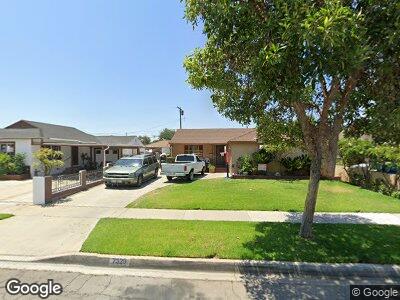
7329 Cravell Ave Pico Rivera, CA 90660
Estimated Value: $693,000 - $796,000
2
Beds
2
Baths
1,022
Sq Ft
$719/Sq Ft
Est. Value
About This Home
This home is located at 7329 Cravell Ave, Pico Rivera, CA 90660 and is currently estimated at $735,288, approximately $719 per square foot. 7329 Cravell Ave is a home located in Los Angeles County with nearby schools including Rivera Academy, El Rancho High School, and Ruben Salazar Continuation School.
Ownership History
Date
Name
Owned For
Owner Type
Purchase Details
Closed on
Sep 5, 2017
Sold by
Espinoza Faustino Duran
Bought by
Espinosa Faustino Duran
Current Estimated Value
Home Financials for this Owner
Home Financials are based on the most recent Mortgage that was taken out on this home.
Original Mortgage
$309,000
Outstanding Balance
$264,305
Interest Rate
3.93%
Mortgage Type
New Conventional
Purchase Details
Closed on
Oct 29, 2010
Sold by
Rosales Isabel M
Bought by
Espinosa Faustino Duran and Garcia Emilio
Home Financials for this Owner
Home Financials are based on the most recent Mortgage that was taken out on this home.
Original Mortgage
$296,013
Interest Rate
4.75%
Mortgage Type
FHA
Purchase Details
Closed on
Jan 9, 1999
Sold by
Rosales Isabel M
Bought by
Rosales Isabel M and Isabel M Rosales Living Trust
Purchase Details
Closed on
Oct 24, 1995
Sold by
Rosales Manuel Herrera
Bought by
Rosales Isabel M
Create a Home Valuation Report for This Property
The Home Valuation Report is an in-depth analysis detailing your home's value as well as a comparison with similar homes in the area
Home Values in the Area
Average Home Value in this Area
Purchase History
| Date | Buyer | Sale Price | Title Company |
|---|---|---|---|
| Espinosa Faustino Duran | -- | Wfg National Title | |
| Espinosa Faustino Duran | $300,000 | Fidelity National Title | |
| Garcia Emilio | -- | Fidelity National Title | |
| Espinosa Faustino Duran | -- | Fidelity National Title | |
| Rosales Isabel M | -- | -- |
Source: Public Records
Mortgage History
| Date | Status | Borrower | Loan Amount |
|---|---|---|---|
| Open | Espinosa Faustino Duran | $309,000 | |
| Previous Owner | Espinosa Faustino Duran | $296,013 |
Source: Public Records
Tax History Compared to Growth
Tax History
| Year | Tax Paid | Tax Assessment Tax Assessment Total Assessment is a certain percentage of the fair market value that is determined by local assessors to be the total taxable value of land and additions on the property. | Land | Improvement |
|---|---|---|---|---|
| 2024 | $6,078 | $423,212 | $290,416 | $132,796 |
| 2023 | $5,911 | $414,915 | $284,722 | $130,193 |
| 2022 | $5,644 | $406,781 | $279,140 | $127,641 |
| 2021 | $5,519 | $398,806 | $273,667 | $125,139 |
| 2019 | $5,491 | $386,978 | $265,550 | $121,428 |
| 2018 | $5,230 | $379,392 | $260,344 | $119,048 |
| 2016 | $4,271 | $324,674 | $212,121 | $112,553 |
| 2015 | $4,207 | $319,798 | $208,935 | $110,863 |
| 2014 | $4,154 | $313,535 | $204,843 | $108,692 |
Source: Public Records
Map
Nearby Homes
- 7244 Bequette Ave
- 7346 Loch Alene Ave
- 9235 Danbridge St
- 7518 Loch Alene Ave
- 9513 Burma Rd
- 7019 Passons Blvd
- 7697 Sage Dr
- 6526 Crossway Dr
- 9412 Haney St
- 6618 Phaeton Ave
- 8529 Carron Dr
- 8165 Shadyside Ave
- 9347 Via Azul
- 9357 Via Azul
- 9349 Via Azul
- 9355 Via Azul
- 8312 Lexington Gallatin Rd
- 8873 Coolhurst Dr
- 9314 Charlesworth Rd
- 8241 Elmont Ave
- 7329 Cravell Ave
- 7323 Cravell Ave
- 7335 Cravell Ave
- 7336 Bequette Ave
- 7319 Cravell Ave
- 7339 Cravell Ave
- 7330 Bequette Ave
- 7340 Bequette Ave
- 7346 Bequette Ave
- 7326 Bequette Ave
- 7326 Cravell Ave
- 7313 Cravell Ave
- 7345 Cravell Ave
- 7332 Cravell Ave
- 7322 Cravell Ave
- 7338 Cravell Ave
- 7350 Bequette Ave
- 7320 Bequette Ave
- 7316 Cravell Ave
- 7342 Cravell Ave