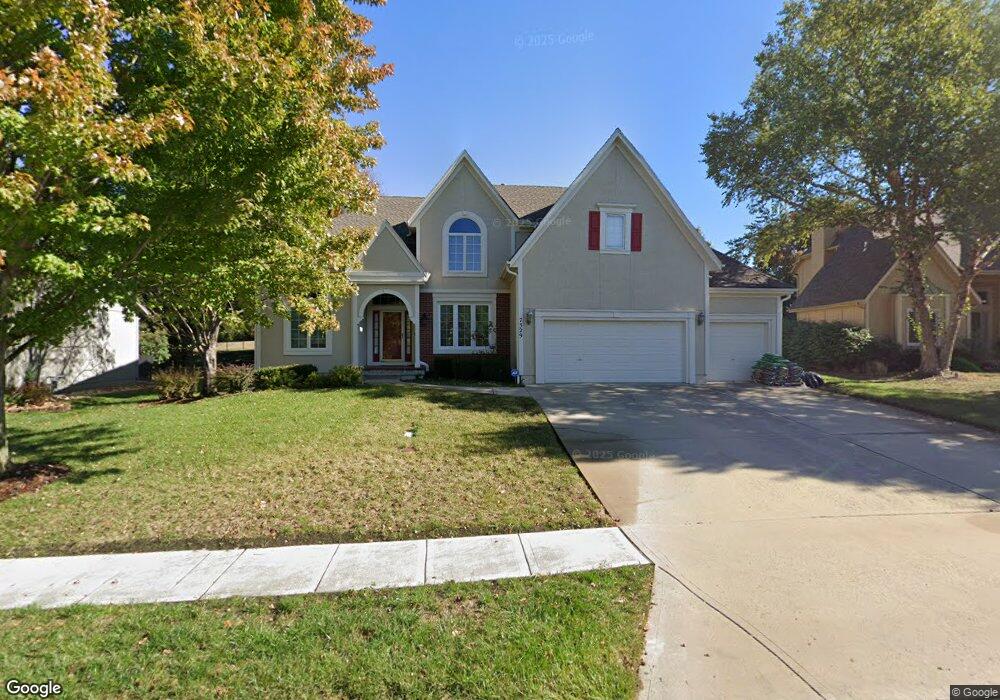
7329 Oakview St Shawnee, KS 66216
Estimated Value: $525,000 - $626,000
4
Beds
4
Baths
3,092
Sq Ft
$190/Sq Ft
Est. Value
About This Home
This home is located at 7329 Oakview St, Shawnee, KS 66216 and is currently estimated at $588,819, approximately $190 per square foot. 7329 Oakview St is a home located in Johnson County with nearby schools including Christa McAuliffe Elementary School, Trailridge Middle School, and Shawnee Mission Northwest High School.
Ownership History
Date
Name
Owned For
Owner Type
Purchase Details
Closed on
Jul 30, 2024
Sold by
Fitzgerald Claire D
Bought by
Claire D Fitzgerald Trust and Fitzgerald
Current Estimated Value
Purchase Details
Closed on
Mar 29, 2012
Sold by
Fitzgerald Daniel
Bought by
Fitzgerald Claire D
Purchase Details
Closed on
Jun 15, 2010
Sold by
Rank Jerry D and Rank Deia Starr
Bought by
Fitzgerald Claire D
Home Financials for this Owner
Home Financials are based on the most recent Mortgage that was taken out on this home.
Original Mortgage
$244,000
Interest Rate
3.5%
Mortgage Type
New Conventional
Create a Home Valuation Report for This Property
The Home Valuation Report is an in-depth analysis detailing your home's value as well as a comparison with similar homes in the area
Home Values in the Area
Average Home Value in this Area
Purchase History
| Date | Buyer | Sale Price | Title Company |
|---|---|---|---|
| Claire D Fitzgerald Trust | -- | None Listed On Document | |
| Fitzgerald Claire D | -- | None Available | |
| Fitzgerald Claire D | -- | Chicago Title Ins Co |
Source: Public Records
Mortgage History
| Date | Status | Borrower | Loan Amount |
|---|---|---|---|
| Previous Owner | Fitzgerald Claire D | $244,000 |
Source: Public Records
Tax History Compared to Growth
Tax History
| Year | Tax Paid | Tax Assessment Tax Assessment Total Assessment is a certain percentage of the fair market value that is determined by local assessors to be the total taxable value of land and additions on the property. | Land | Improvement |
|---|---|---|---|---|
| 2024 | $6,529 | $61,192 | $12,179 | $49,013 |
| 2023 | $6,169 | $57,419 | $9,370 | $48,049 |
| 2022 | $5,340 | $49,553 | $9,370 | $40,183 |
| 2021 | $5,186 | $45,321 | $9,370 | $35,951 |
| 2020 | $5,094 | $43,941 | $9,370 | $34,571 |
| 2019 | $4,867 | $41,952 | $8,519 | $33,433 |
| 2018 | $4,857 | $41,710 | $8,519 | $33,191 |
| 2017 | $4,731 | $39,997 | $7,750 | $32,247 |
| 2016 | $4,684 | $39,100 | $7,750 | $31,350 |
| 2015 | $4,291 | $37,030 | $7,750 | $29,280 |
| 2013 | -- | $34,949 | $7,750 | $27,199 |
Source: Public Records
Map
Nearby Homes
- 7325 Oakview St
- 7029 Albervan St
- 13903 W 71st Place
- 13800 W 75th Ct
- 6942 Constance St
- 13716 W 75th Terrace
- 7219 Allman Rd
- 7239 Allman Rd
- 7221 Allman Rd
- 7237 Allman Rd
- 7231 Allman Rd
- 7229 Allman Dr
- 7514 Caenen Lake Rd
- 13004 W 74th Terrace
- 13100 W 72nd St
- 16128 Midland Dr
- 7115 Richards Dr
- 7105 Richards Dr
- 7621 Lichtenauer Dr
- 14406 W 65th Terrace
- 7333 Oakview St
- 7321 Oakview St
- 7337 Oakview St
- 7326 Oakview St
- 7330 Oakview St
- 7322 Oakview St
- 7334 Oakview St
- 7313 Oakview St
- 7341 Oakview St
- 7310 Acuff St
- 7318 Oakview St
- 7340 Oakview St
- 7314 Oakview St
- 7345 Oakview St
- 7306 Acuff St
- 7344 Oakview St
- 7310 Oakview St
- 7213 Oakview St
- 7311 Acuff St
- 7350 Oakview St