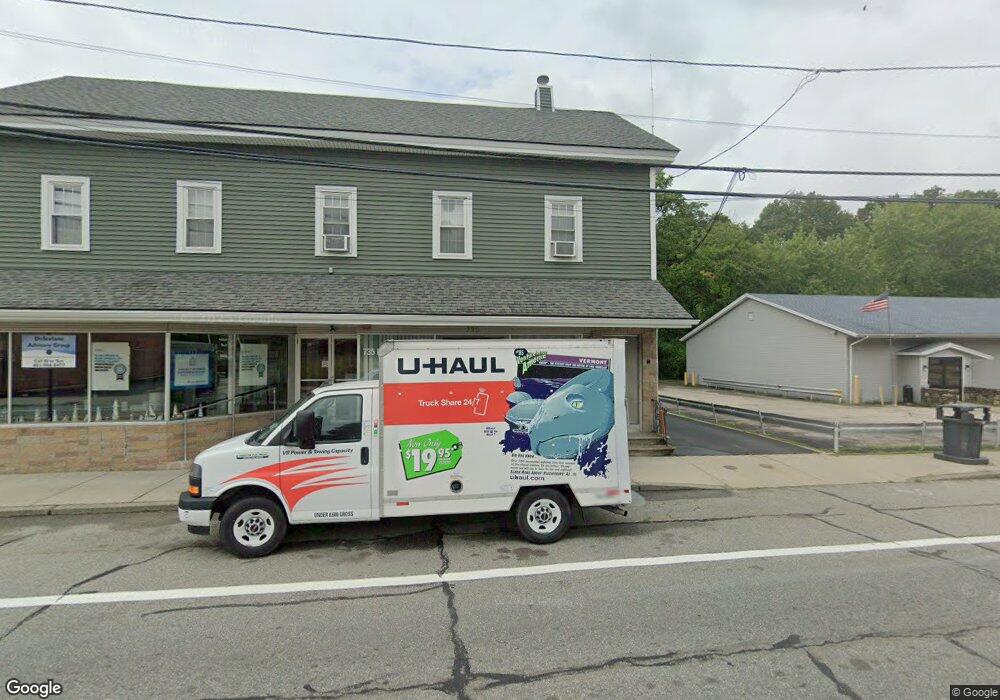
733 Main St West Warwick, RI 02893
Lippitt-Harris NeighborhoodEstimated Value: $538,326
3
Beds
5
Baths
4,891
Sq Ft
$110/Sq Ft
Est. Value
About This Home
This home is located at 733 Main St, West Warwick, RI 02893 and is currently estimated at $538,326, approximately $110 per square foot. 733 Main St is a home located in Kent County with nearby schools including West Warwick High School and St Joseph School.
Ownership History
Date
Name
Owned For
Owner Type
Purchase Details
Closed on
Oct 27, 2011
Sold by
Paliotta Robert W and Paliotta Edwina
Bought by
Ropal Investments
Current Estimated Value
Purchase Details
Closed on
Feb 4, 2008
Sold by
Tougas Joanne
Bought by
Paliotta Robert W and Paliotta Edwina
Home Financials for this Owner
Home Financials are based on the most recent Mortgage that was taken out on this home.
Original Mortgage
$150,000
Interest Rate
6.18%
Mortgage Type
Commercial
Purchase Details
Closed on
Aug 16, 1994
Sold by
Coventry Cu
Bought by
Tougas Steven P and Tougas Joanne
Create a Home Valuation Report for This Property
The Home Valuation Report is an in-depth analysis detailing your home's value as well as a comparison with similar homes in the area
Home Values in the Area
Average Home Value in this Area
Purchase History
| Date | Buyer | Sale Price | Title Company |
|---|---|---|---|
| Ropal Investments | -- | -- | |
| Ropal Investments | -- | -- | |
| Paliotta Robert W | $290,000 | -- | |
| Paliotta Robert W | $290,000 | -- | |
| Tougas Steven P | $65,000 | -- | |
| Tougas Steven P | $65,000 | -- |
Source: Public Records
Mortgage History
| Date | Status | Borrower | Loan Amount |
|---|---|---|---|
| Previous Owner | Tougas Steven P | $150,000 |
Source: Public Records
Tax History Compared to Growth
Tax History
| Year | Tax Paid | Tax Assessment Tax Assessment Total Assessment is a certain percentage of the fair market value that is determined by local assessors to be the total taxable value of land and additions on the property. | Land | Improvement |
|---|---|---|---|---|
| 2025 | $5,317 | $372,100 | $95,000 | $277,100 |
| 2024 | -- | $264,000 | $63,100 | $200,900 |
| 2023 | $0 | $264,000 | $63,100 | $200,900 |
| 2022 | $0 | $264,000 | $63,100 | $200,900 |
| 2021 | $0 | $249,900 | $49,400 | $200,500 |
| 2020 | $0 | $249,900 | $49,400 | $200,500 |
| 2019 | $0 | $249,900 | $49,400 | $200,500 |
| 2018 | $0 | $224,300 | $47,900 | $176,400 |
| 2017 | $0 | $224,300 | $47,900 | $176,400 |
| 2016 | -- | $224,300 | $47,900 | $176,400 |
| 2015 | -- | $210,500 | $45,600 | $164,900 |
| 2014 | -- | $210,500 | $45,600 | $164,900 |
Source: Public Records
Map
Nearby Homes