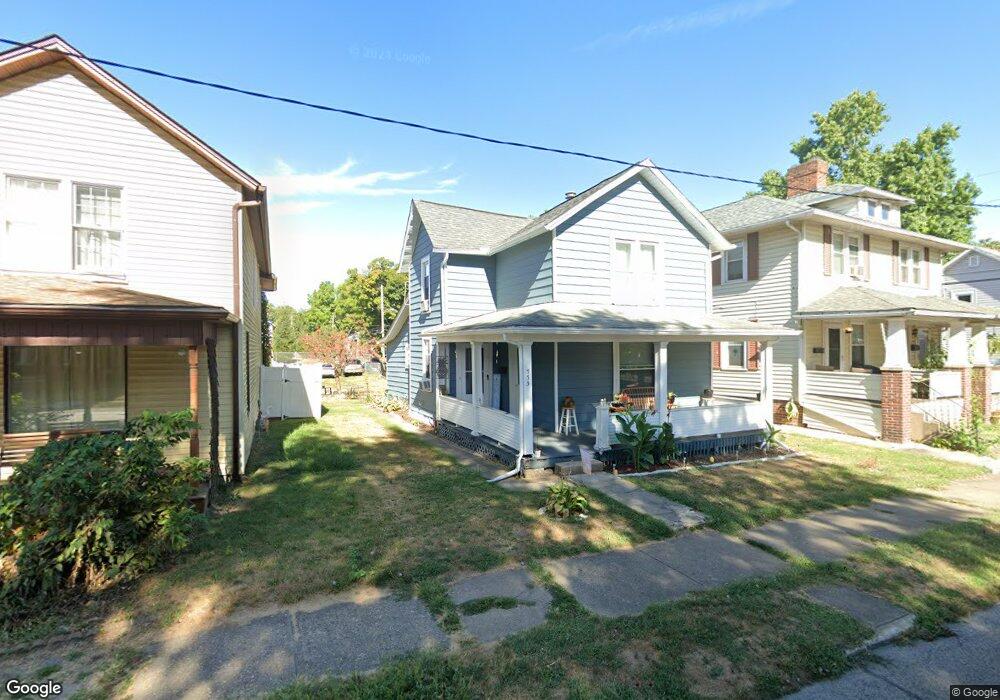
733 N High St Lancaster, OH 43130
Estimated Value: $168,081 - $223,000
2
Beds
1
Bath
1,238
Sq Ft
$151/Sq Ft
Est. Value
About This Home
This home is located at 733 N High St, Lancaster, OH 43130 and is currently estimated at $187,520, approximately $151 per square foot. 733 N High St is a home located in Fairfield County with nearby schools including Thomas Ewing Junior High School, Lancaster High School, and St Mary Elementary School.
Ownership History
Date
Name
Owned For
Owner Type
Purchase Details
Closed on
Sep 7, 2018
Sold by
Brewer Ray
Bought by
Grada Ltd
Current Estimated Value
Purchase Details
Closed on
Mar 8, 2002
Sold by
Investors Of Tomorrow Tr
Bought by
Brewer Roy
Purchase Details
Closed on
Dec 3, 1999
Sold by
Norris F Peters Trst
Bought by
Pettet Edward T
Purchase Details
Closed on
Dec 7, 1993
Sold by
Warfield Donald Ray
Bought by
Peters Norris F Et Al Trustees
Create a Home Valuation Report for This Property
The Home Valuation Report is an in-depth analysis detailing your home's value as well as a comparison with similar homes in the area
Home Values in the Area
Average Home Value in this Area
Purchase History
| Date | Buyer | Sale Price | Title Company |
|---|---|---|---|
| Grada Ltd | $44,000 | Valmer Land Title Agency | |
| Brewer Roy | $65,000 | -- | |
| Pettet Edward T | $40,900 | -- | |
| Peters Norris F Et Al Trustees | $38,000 | -- |
Source: Public Records
Mortgage History
| Date | Status | Borrower | Loan Amount |
|---|---|---|---|
| Closed | Pettet Edward T | $0 |
Source: Public Records
Tax History
| Year | Tax Paid | Tax Assessment Tax Assessment Total Assessment is a certain percentage of the fair market value that is determined by local assessors to be the total taxable value of land and additions on the property. | Land | Improvement |
|---|---|---|---|---|
| 2025 | $3,825 | $49,210 | $11,810 | $37,400 |
| 2024 | $3,825 | $42,550 | $5,690 | $36,860 |
| 2023 | $1,581 | $42,550 | $5,690 | $36,860 |
| 2022 | $1,590 | $42,550 | $5,690 | $36,860 |
| 2021 | $1,345 | $33,740 | $5,690 | $28,050 |
| 2020 | $1,291 | $33,740 | $5,690 | $28,050 |
| 2019 | $1,229 | $33,740 | $5,690 | $28,050 |
| 2018 | $914 | $25,240 | $5,690 | $19,550 |
| 2017 | $915 | $23,840 | $4,290 | $19,550 |
| 2016 | $892 | $23,840 | $4,290 | $19,550 |
| 2015 | $885 | $22,970 | $4,290 | $18,680 |
| 2014 | $844 | $22,970 | $4,290 | $18,680 |
| 2013 | $844 | $22,970 | $4,290 | $18,680 |
Source: Public Records
Map
Nearby Homes
- 165 Lake St
- 311 E Allen St
- 600 N High St
- 820 N Broad St
- 123 Arnold Ave
- 430 N High St
- 617 N Maple St
- 130 W Fair Ave
- 153 King St
- 526 N Columbus St
- 627 N Columbus St
- 925 N Columbus St
- 515 N Columbus St
- 712 N Mount Pleasant Ave
- 249 N Pearl Ave
- 308 Reber Ave
- 610 E 5th Ave
- 547 E Mulberry St
- 336 Reber Ave
- 1156 Forest Rose Ave
Your Personal Tour Guide
Ask me questions while you tour the home.