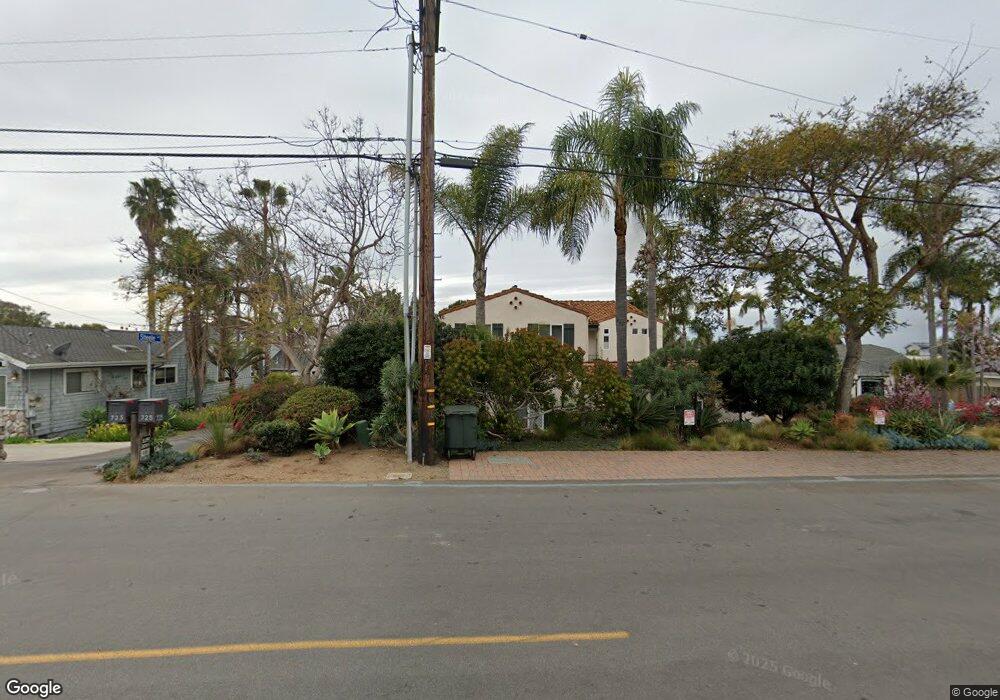
733 N Rios Ave Solana Beach, CA 92075
Estimated Value: $4,570,701 - $5,967,000
3
Beds
4
Baths
3,816
Sq Ft
$1,353/Sq Ft
Est. Value
About This Home
This home is located at 733 N Rios Ave, Solana Beach, CA 92075 and is currently estimated at $5,162,925, approximately $1,352 per square foot. 733 N Rios Ave is a home located in San Diego County with nearby schools including Skyline Elementary School, Solana Vista Elementary School, and Earl Warren Middle School.
Ownership History
Date
Name
Owned For
Owner Type
Purchase Details
Closed on
Aug 19, 2013
Sold by
Phuong Oanh and Phuong Hai V
Bought by
Phuong Hai and Phuong Oanh
Current Estimated Value
Purchase Details
Closed on
Sep 26, 2011
Sold by
Royce Stephen M and Royce Karen H
Bought by
Phuong Oanh Thi Tuyet and Phuong Hai Van
Home Financials for this Owner
Home Financials are based on the most recent Mortgage that was taken out on this home.
Original Mortgage
$1,300,000
Outstanding Balance
$116,530
Interest Rate
3.25%
Mortgage Type
New Conventional
Estimated Equity
$5,046,395
Purchase Details
Closed on
Sep 1, 2009
Sold by
Ewing Dolores H
Bought by
Royce Stephen M and Royce Karen H
Purchase Details
Closed on
Nov 28, 2006
Sold by
Ewing Frank A and Ewing Dolores H
Bought by
Ewing Frank A and Ewing Dolores H
Create a Home Valuation Report for This Property
The Home Valuation Report is an in-depth analysis detailing your home's value as well as a comparison with similar homes in the area
Home Values in the Area
Average Home Value in this Area
Purchase History
| Date | Buyer | Sale Price | Title Company |
|---|---|---|---|
| Phuong Hai | -- | None Available | |
| Phuong Hai | -- | None Available | |
| Phuong Oanh Thi Tuyet | $1,737,000 | First American Title Company | |
| Royce Stephen M | $720,000 | First American Title | |
| Ewing Frank A | -- | None Available | |
| Ewing Frank A | -- | None Available |
Source: Public Records
Mortgage History
| Date | Status | Borrower | Loan Amount |
|---|---|---|---|
| Open | Phuong Oanh Thi Tuyet | $1,300,000 |
Source: Public Records
Tax History Compared to Growth
Tax History
| Year | Tax Paid | Tax Assessment Tax Assessment Total Assessment is a certain percentage of the fair market value that is determined by local assessors to be the total taxable value of land and additions on the property. | Land | Improvement |
|---|---|---|---|---|
| 2025 | $23,477 | $2,181,259 | $1,431,902 | $749,357 |
| 2024 | $23,477 | $2,138,490 | $1,403,826 | $734,664 |
| 2023 | $22,981 | $2,096,559 | $1,376,300 | $720,259 |
| 2022 | $22,628 | $2,055,451 | $1,349,314 | $706,137 |
| 2021 | $22,241 | $2,015,149 | $1,322,857 | $692,292 |
| 2020 | $22,052 | $1,994,487 | $1,309,293 | $685,194 |
| 2019 | $21,639 | $1,955,380 | $1,283,621 | $671,759 |
| 2018 | $21,223 | $1,917,040 | $1,258,452 | $658,588 |
| 2017 | $20,857 | $1,879,452 | $1,233,777 | $645,675 |
| 2016 | $19,619 | $1,842,601 | $1,209,586 | $633,015 |
| 2015 | $19,317 | $1,814,924 | $1,191,417 | $623,507 |
| 2014 | $18,915 | $1,779,373 | $1,168,079 | $611,294 |
Source: Public Records
Map
Nearby Homes
- 810 Seabright Ln
- 649 Seabright Ln
- 779 Barbara Ave
- 505 N Cedros Ave
- 515 N Acacia Ave
- 422 Seabright Ln
- 241 E Cliff St
- 524 Ford Ave
- 455 Glencrest Dr
- 148 N Acacia Ave
- 147 S Rios Ave
- 2459 Caminito Ocean Cove
- 308 Corto St
- 2738 Mackinnon Ranch Rd
- 2721 Mackinnon Ranch Rd
- 325 S Sierra Ave Unit 20
- 401 Santa Dominga
- 2542 Manchester Ave Unit U2
- 165 Kilkenny Dr
- 429 S Sierra Ave Unit 151
- 723 N Rios Ave
- 727 N Rios Ave
- 745 N Rios Ave
- 719 N Rios Ave
- 719 N Rios Ave
- 738 Seabright Ln
- 734 Seabright Ln
- 707 N Rios Ave
- 808 Seabright Ln
- 801 N Rios Ave
- 726 Seabright Ln
- 715 N Rios Ave
- 742 Seabright Ln
- 720 Seabright Ln
- 807 N Rios Ave
- 804 Seabright Ln
- 703 N Rios Ave
- 701 N Rios Ave
- 708 N Rios Ave
- 710 Seabright Ln