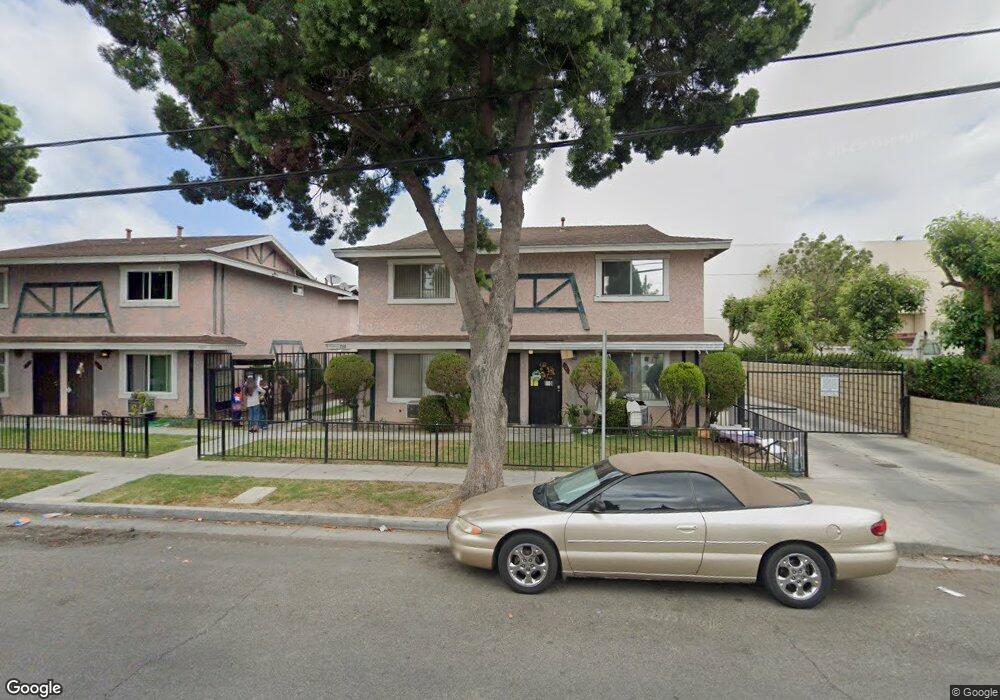
7331 Exeter St Unit 205 Paramount, CA 90723
Estimated Value: $416,645 - $488,000
2
Beds
2
Baths
985
Sq Ft
$448/Sq Ft
Est. Value
About This Home
This home is located at 7331 Exeter St Unit 205, Paramount, CA 90723 and is currently estimated at $441,411, approximately $448 per square foot. 7331 Exeter St Unit 205 is a home located in Los Angeles County with nearby schools including Howard Tanner School, Frank J. Zamboni School, and Paramount High School.
Ownership History
Date
Name
Owned For
Owner Type
Purchase Details
Closed on
Jan 28, 2000
Sold by
Washington Mutual Bank Fa
Bought by
Mckeag Charles C and Mckeag Family Trust
Current Estimated Value
Purchase Details
Closed on
May 27, 1999
Sold by
Menjivar Julio and Mendez Byron Leonel
Bought by
Washington Mutual Bank Fa and Home Svgs Of America Fsb
Purchase Details
Closed on
Dec 27, 1994
Sold by
Marble Denise Danielle
Bought by
Marble Bruce Brian
Home Financials for this Owner
Home Financials are based on the most recent Mortgage that was taken out on this home.
Original Mortgage
$84,600
Interest Rate
9.09%
Purchase Details
Closed on
Dec 15, 1994
Sold by
Marble Bruce Brian and Marble Geraldine F
Bought by
Menjivar Julio and Mendez Byron Leonel
Home Financials for this Owner
Home Financials are based on the most recent Mortgage that was taken out on this home.
Original Mortgage
$84,600
Interest Rate
9.09%
Create a Home Valuation Report for This Property
The Home Valuation Report is an in-depth analysis detailing your home's value as well as a comparison with similar homes in the area
Home Values in the Area
Average Home Value in this Area
Purchase History
| Date | Buyer | Sale Price | Title Company |
|---|---|---|---|
| Mckeag Charles C | $82,000 | Chicago Title Co | |
| Washington Mutual Bank Fa | $64,289 | First American Title Ins Co | |
| Marble Bruce Brian | -- | Chicago Title Insurance Co | |
| Menjivar Julio | $94,000 | Chicago Title Insurance Co |
Source: Public Records
Mortgage History
| Date | Status | Borrower | Loan Amount |
|---|---|---|---|
| Previous Owner | Menjivar Julio | $84,600 |
Source: Public Records
Tax History
| Year | Tax Paid | Tax Assessment Tax Assessment Total Assessment is a certain percentage of the fair market value that is determined by local assessors to be the total taxable value of land and additions on the property. | Land | Improvement |
|---|---|---|---|---|
| 2025 | $1,868 | $126,006 | $25,190 | $100,816 |
| 2024 | $1,868 | $123,537 | $24,697 | $98,840 |
| 2023 | $1,835 | $121,115 | $24,213 | $96,902 |
| 2022 | $1,785 | $118,741 | $23,739 | $95,002 |
| 2021 | $1,742 | $116,414 | $23,274 | $93,140 |
| 2019 | $1,771 | $112,963 | $22,585 | $90,378 |
| 2018 | $1,640 | $110,749 | $22,143 | $88,606 |
| 2016 | $1,476 | $106,450 | $21,284 | $85,166 |
| 2015 | $1,401 | $104,852 | $20,965 | $83,887 |
| 2014 | $1,433 | $102,799 | $20,555 | $82,244 |
Source: Public Records
Map
Nearby Homes
- 14944 Texaco Ave
- 3 Rosecrans Ave
- 7032 Somerset Blvd
- 15137 Gundry Ave Unit F
- 13944 Brightwell Ave
- 13959 Arthur Ave Unit 1
- 6656 Rosecrans Ave Unit N-10
- 15325 Orange Ave
- 13827 Fairlock Ave
- 15336 Colorado Ave
- 15351 Orange Ave Unit 17
- 6556 San Vincente St
- 15323 Paramount Blvd
- 6542 San Luis St
- 14134 Orizaba Ave
- 15538 Colorado Ave
- 8203 2nd St
- 14045 Anderson St Unit 1/2
- 8211 Wilbarn St
- 8215 Sandy Ln
- 7327 Exeter St
- 7331 Exeter St Unit 208
- 7331 Exeter St Unit 207
- 7331 Exeter St Unit 206
- 7331 Exeter St Unit 204
- 7331 Exeter St Unit 203
- 7331 Exeter St Unit 202
- 7331 Exeter St Unit 201
- 7327 Exeter St Unit 110
- 7327 Exeter St Unit 109
- 7327 Exeter St Unit 108
- 7327 Exeter St Unit 107
- 7327 Exeter St Unit 106
- 7327 Exeter St Unit 105
- 7327 Exeter St Unit 103
- 7327 Exeter St Unit 102
- 7327 Exeter St Unit 101
- 7349 Exeter St
- 7339 Exeter St
- 7323 Exeter St
Your Personal Tour Guide
Ask me questions while you tour the home.