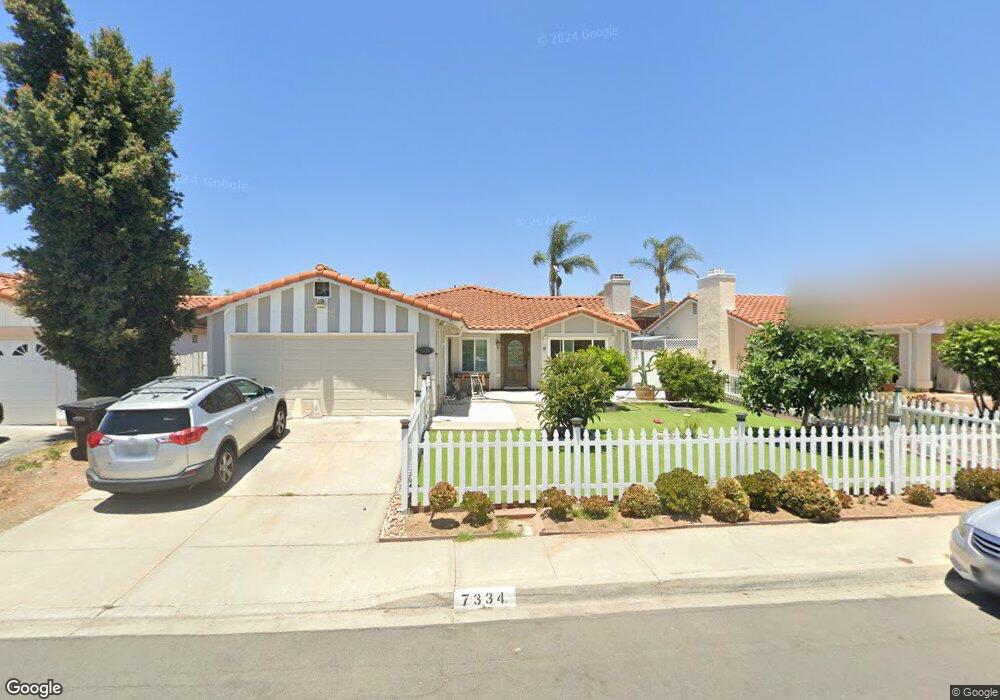
7334 Dancy Rd San Diego, CA 92126
Mira Mesa NeighborhoodEstimated Value: $1,157,000 - $1,256,000
4
Beds
2
Baths
1,974
Sq Ft
$604/Sq Ft
Est. Value
About This Home
This home is located at 7334 Dancy Rd, San Diego, CA 92126 and is currently estimated at $1,193,114, approximately $604 per square foot. 7334 Dancy Rd is a home located in San Diego County with nearby schools including Jonas Salk Elementary School, Challenger Middle School, and Mira Mesa High School.
Ownership History
Date
Name
Owned For
Owner Type
Purchase Details
Closed on
Apr 27, 2016
Sold by
Mitchell Mark E and Mitchell Cindi L
Bought by
Ghen Spark Yingshan and Yang Lan
Current Estimated Value
Home Financials for this Owner
Home Financials are based on the most recent Mortgage that was taken out on this home.
Original Mortgage
$465,000
Interest Rate
3.64%
Mortgage Type
New Conventional
Purchase Details
Closed on
Jun 21, 1989
Create a Home Valuation Report for This Property
The Home Valuation Report is an in-depth analysis detailing your home's value as well as a comparison with similar homes in the area
Home Values in the Area
Average Home Value in this Area
Purchase History
| Date | Buyer | Sale Price | Title Company |
|---|---|---|---|
| Ghen Spark Yingshan | $620,000 | First American Title | |
| -- | $169,500 | -- |
Source: Public Records
Mortgage History
| Date | Status | Borrower | Loan Amount |
|---|---|---|---|
| Previous Owner | Ghen Spark Yingshan | $465,000 |
Source: Public Records
Tax History
| Year | Tax Paid | Tax Assessment Tax Assessment Total Assessment is a certain percentage of the fair market value that is determined by local assessors to be the total taxable value of land and additions on the property. | Land | Improvement |
|---|---|---|---|---|
| 2025 | $8,716 | $719,555 | $205,866 | $513,689 |
| 2024 | $8,716 | $705,447 | $201,830 | $503,617 |
| 2023 | $8,438 | $691,616 | $197,873 | $493,743 |
| 2022 | $8,211 | $678,056 | $193,994 | $484,062 |
| 2021 | $8,153 | $664,762 | $190,191 | $474,571 |
| 2020 | $8,053 | $657,946 | $188,241 | $469,705 |
| 2019 | $7,907 | $645,046 | $184,550 | $460,496 |
| 2018 | $7,392 | $632,399 | $180,932 | $451,467 |
| 2017 | $7,212 | $620,000 | $177,385 | $442,615 |
| 2016 | $4,511 | $387,813 | $110,955 | $276,858 |
| 2015 | $4,444 | $381,989 | $109,289 | $272,700 |
| 2014 | $4,373 | $374,508 | $107,149 | $267,359 |
Source: Public Records
Map
Nearby Homes
- 10242 Keoki St
- 7427 Kamwood St
- 8025 Silvercrest Way
- 11026 Eka Way
- 10385 Cheviot Ct
- 10434 Cheviot Ct
- 10502 Coupland Way
- 10894 Aderman Ave Unit 191
- 10662 Senna Way
- 14006 Lemurine Way
- 10462 Newbliss Way
- 10606 Aderman Ave Unit 5
- 10411 Walden Way
- 8177 Rose Quartz Cir
- 10635 Melogold Way
- 10620 Granby Way
- 10668 Dabney Dr Unit 125
- 10620 Dabney Dr Unit 172
- 7774 Gaston Dr
- 13920 Boyden Way
Your Personal Tour Guide
Ask me questions while you tour the home.