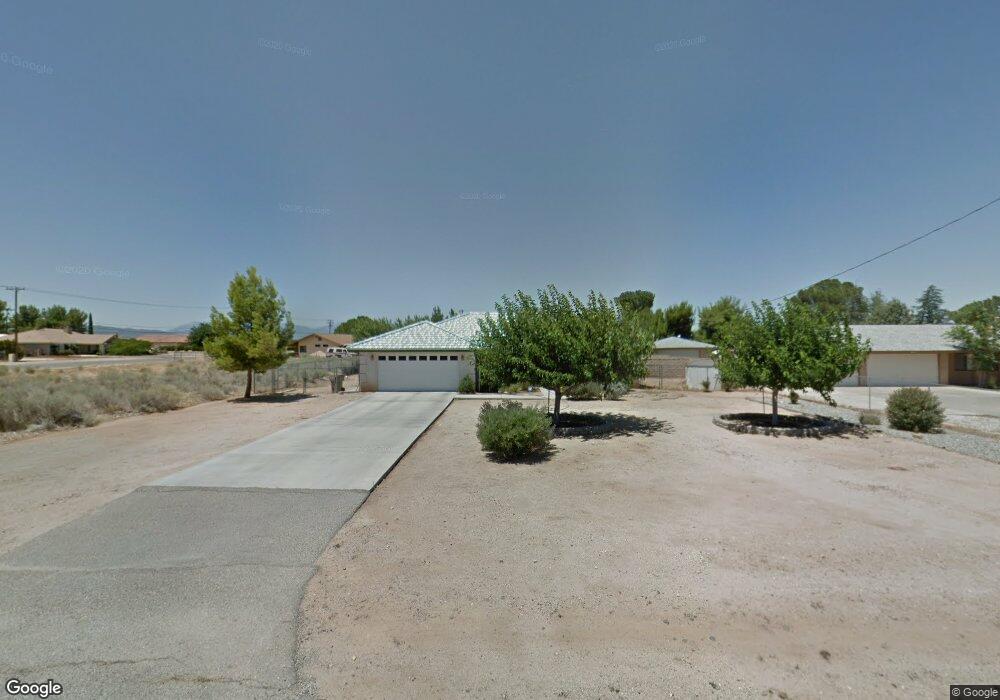
7334 Kenyon Ave Hesperia, CA 92345
The Mesa NeighborhoodEstimated Value: $462,000 - $495,000
4
Beds
2
Baths
1,825
Sq Ft
$264/Sq Ft
Est. Value
About This Home
This home is located at 7334 Kenyon Ave, Hesperia, CA 92345 and is currently estimated at $482,583, approximately $264 per square foot. 7334 Kenyon Ave is a home located in San Bernardino County with nearby schools including Kingston Elementary School, Ranchero Middle School, and Sultana High School.
Ownership History
Date
Name
Owned For
Owner Type
Purchase Details
Closed on
May 18, 1998
Sold by
Grove Tracy
Bought by
Grove Gary E
Current Estimated Value
Home Financials for this Owner
Home Financials are based on the most recent Mortgage that was taken out on this home.
Original Mortgage
$109,408
Interest Rate
6.71%
Purchase Details
Closed on
May 15, 1998
Sold by
Severson Howard J and Severson Elinor D
Bought by
Grove Gary E
Home Financials for this Owner
Home Financials are based on the most recent Mortgage that was taken out on this home.
Original Mortgage
$109,408
Interest Rate
6.71%
Purchase Details
Closed on
May 13, 1998
Sold by
Grove Gary E
Bought by
Zavella Jose Z and Zavella Sharon A
Home Financials for this Owner
Home Financials are based on the most recent Mortgage that was taken out on this home.
Original Mortgage
$109,408
Interest Rate
6.71%
Create a Home Valuation Report for This Property
The Home Valuation Report is an in-depth analysis detailing your home's value as well as a comparison with similar homes in the area
Home Values in the Area
Average Home Value in this Area
Purchase History
We collect this data history from publicly available records. To have your information removed, we recommend requesting removal directly through your county’s website.
| Date | Buyer | Sale Price | Title Company |
|---|---|---|---|
| Grove Gary E | -- | First American Title Ins Co | |
| Grove Gary E | $11,000 | First American Title Ins Co | |
| Zavella Jose Z | $110,000 | First American Title Ins Co |
Source: Public Records
Mortgage History
We collect this data history from publicly available records. To have your information removed, we recommend requesting removal directly through your county’s website.
| Date | Status | Borrower | Loan Amount |
|---|---|---|---|
| Previous Owner | Zavella Jose Z | $109,408 |
Source: Public Records
Tax History
| Year | Tax Paid | Tax Assessment Tax Assessment Total Assessment is a certain percentage of the fair market value that is determined by local assessors to be the total taxable value of land and additions on the property. | Land | Improvement |
|---|---|---|---|---|
| 2025 | $2,144 | $191,570 | $18,816 | $172,754 |
| 2024 | $2,096 | $187,814 | $18,447 | $169,367 |
| 2023 | $2,073 | $184,131 | $18,085 | $166,046 |
| 2022 | $2,026 | $180,520 | $17,730 | $162,790 |
| 2021 | $1,990 | $176,980 | $17,382 | $159,598 |
| 2020 | $1,966 | $175,166 | $17,204 | $157,962 |
| 2019 | $1,926 | $171,732 | $16,867 | $154,865 |
| 2018 | $1,890 | $168,364 | $16,536 | $151,828 |
| 2017 | $1,857 | $165,063 | $16,212 | $148,851 |
| 2016 | $1,818 | $161,826 | $15,894 | $145,932 |
| 2015 | -- | $159,395 | $15,655 | $143,740 |
| 2014 | $1,771 | $156,272 | $15,348 | $140,924 |
Source: Public Records
Map
Nearby Homes
- 7337 Jenkins Ave
- 7454 Lyons Ave
- 17111 Ranchero St
- 0 Ranchero St
- 7090 Kenyon Ave
- 17590 El Cajon Dr
- 7040 Kenyon Ave
- 7602 Newhall Ave
- 0 Farmdale Ave Unit IG25128388
- 7653 Montrose Ave
- 7589 Glider Ave
- 7051 Milton Ave
- 7191 Doheny Ct
- 7181 Doheny Ct
- 17041 Fairburn St
- 7144 Farmdale Ave
- 17355 La Junta St
- 7141 Doheny Ct
- 7181 Dohney Ct
- 7158 Dohney Ct
- 7312 Kenyon Ave
- 7348 Kenyon Ave
- 0 Kenyon Unit EV14132814
- 0 Kenyon Unit EV15188107
- 0 Kenyon Unit EV16087090
- 0 Kenyon Unit EV16707802
- 0 Kenyon Unit 437623
- 0 Kenyon Unit 477012
- 0 Kenyon Unit 461578
- 0 Kenyon Unit 471060
- 7364 Kenyon Ave
- 17354 Ranchero Rd
- 7349 Jenkins Ave
- 7335 Kenyon Ave
- 7345 Kenyon Ave
- 7313 Kenyon Ave
- 7288 Kenyon Ave
- 7376 Kenyon Ave
- 7351 Kenyon Ave
- 7363 Jenkins Ave
Your Personal Tour Guide
Ask me questions while you tour the home.