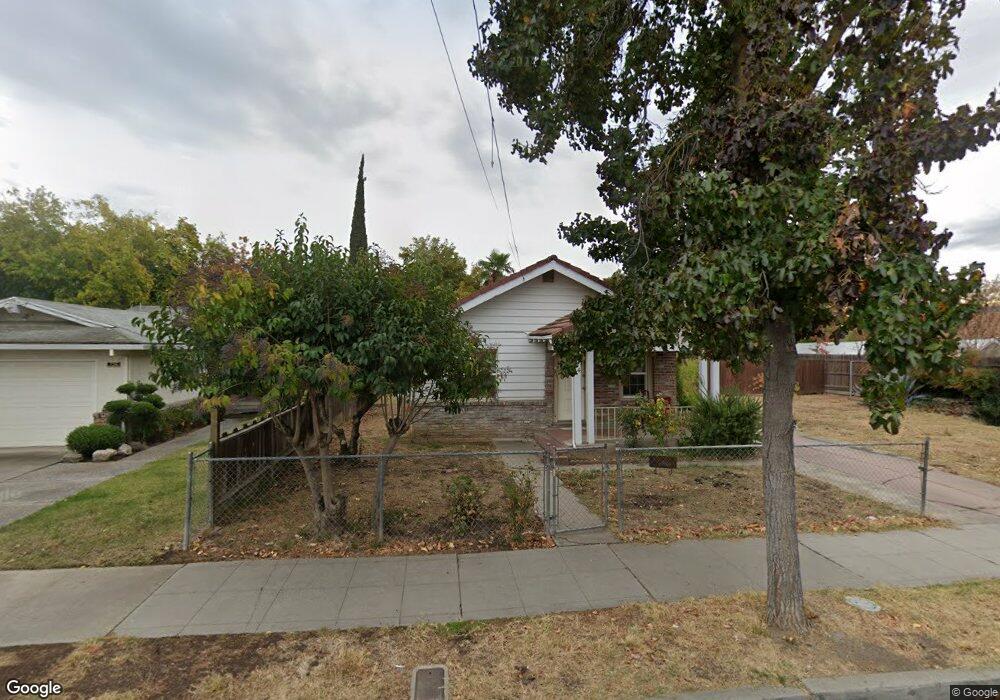
734 E 6th St Stockton, CA 95206
Seaport NeighborhoodEstimated Value: $245,000 - $334,000
2
Beds
1
Bath
830
Sq Ft
$326/Sq Ft
Est. Value
About This Home
This home is located at 734 E 6th St, Stockton, CA 95206 and is currently estimated at $270,800, approximately $326 per square foot. 734 E 6th St is a home located in San Joaquin County with nearby schools including McKinley Elementary School, Spanos (Alex G.) Elementary School, and Dolores Huerta Elementary School.
Ownership History
Date
Name
Owned For
Owner Type
Purchase Details
Closed on
Mar 12, 2010
Sold by
U S Bank National Association
Bought by
Dominguez Martin
Current Estimated Value
Purchase Details
Closed on
Nov 3, 2009
Sold by
Soria Salvador and Soria Oralia
Bought by
U S Bank National Association
Purchase Details
Closed on
May 26, 2006
Sold by
Tibon Ronald P
Bought by
Soria Salvador and Soria Oralia
Home Financials for this Owner
Home Financials are based on the most recent Mortgage that was taken out on this home.
Original Mortgage
$179,250
Interest Rate
6.99%
Mortgage Type
Balloon
Purchase Details
Closed on
May 26, 1999
Sold by
Tibon Pastor P and Tibon Ronald P
Bought by
Tibon Ronald P
Home Financials for this Owner
Home Financials are based on the most recent Mortgage that was taken out on this home.
Original Mortgage
$37,600
Interest Rate
7.97%
Create a Home Valuation Report for This Property
The Home Valuation Report is an in-depth analysis detailing your home's value as well as a comparison with similar homes in the area
Home Values in the Area
Average Home Value in this Area
Purchase History
| Date | Buyer | Sale Price | Title Company |
|---|---|---|---|
| Dominguez Martin | $55,000 | Fidelity National Title Co | |
| Dominguez Martin | -- | Fidelity National Title Co | |
| U S Bank National Association | $31,500 | Accommodation | |
| Soria Salvador | -- | Alliance Title Company | |
| Tibon Ronald P | $35,000 | Chicago Title Co |
Source: Public Records
Mortgage History
| Date | Status | Borrower | Loan Amount |
|---|---|---|---|
| Previous Owner | Soria Salvador | $179,250 | |
| Previous Owner | Tibon Ronald P | $37,600 |
Source: Public Records
Tax History
| Year | Tax Paid | Tax Assessment Tax Assessment Total Assessment is a certain percentage of the fair market value that is determined by local assessors to be the total taxable value of land and additions on the property. | Land | Improvement |
|---|---|---|---|---|
| 2025 | $909 | $70,982 | $16,774 | $54,208 |
| 2024 | $895 | $69,592 | $16,446 | $53,146 |
| 2023 | $875 | $68,228 | $16,124 | $52,104 |
| 2022 | $866 | $66,891 | $15,808 | $51,083 |
| 2021 | $833 | $65,581 | $15,499 | $50,082 |
| 2020 | $848 | $64,910 | $15,341 | $49,569 |
| 2019 | $845 | $63,639 | $15,041 | $48,598 |
| 2018 | $829 | $62,393 | $14,747 | $47,646 |
| 2017 | $786 | $61,170 | $14,458 | $46,712 |
| 2016 | $800 | $59,971 | $14,175 | $45,796 |
| 2015 | $799 | $59,070 | $13,962 | $45,108 |
| 2014 | $762 | $57,914 | $13,689 | $44,225 |
Source: Public Records
Map
Nearby Homes
- 2020 S American St
- 1913 S California St
- 822 E 4th St
- 1761 Sikh Temple St
- 1954 S Sutter St
- 1105 E 7th St
- 2104 S Union St
- 231 E 5th St
- 2319 S Union St
- 2035 S Hunter St
- 1554 S San Joaquin St
- 1430 E 7th St
- 1731 S Center St
- 1516 S Hunter St
- 1553 E 7th St
- 1215 S American St
- 1121 E Clay St
- 220 Delhi Ave
- 446 E Anderson St
- 333 W 4th St
Your Personal Tour Guide
Ask me questions while you tour the home.