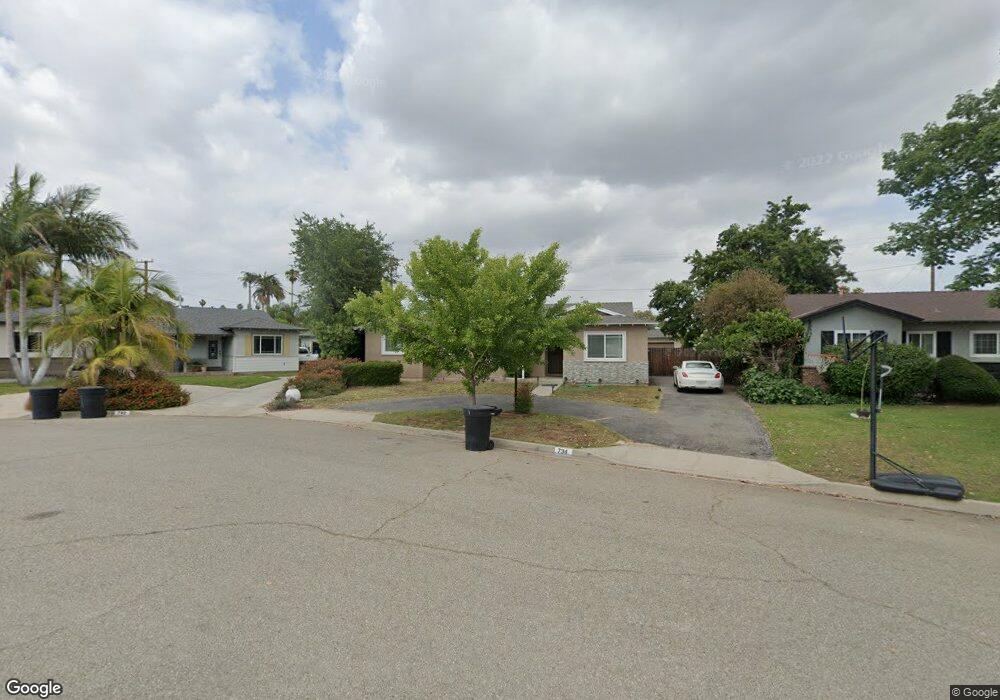
734 N Butterfield Rd West Covina, CA 91791
Estimated Value: $819,000 - $891,000
3
Beds
2
Baths
1,470
Sq Ft
$577/Sq Ft
Est. Value
About This Home
This home is located at 734 N Butterfield Rd, West Covina, CA 91791 and is currently estimated at $848,617, approximately $577 per square foot. 734 N Butterfield Rd is a home located in Los Angeles County with nearby schools including Grovecenter Elementary School, Traweek Middle School, and Covina High School.
Ownership History
Date
Name
Owned For
Owner Type
Purchase Details
Closed on
Apr 18, 2016
Sold by
Barrera Tony and Barrera Maria
Bought by
Barrera Anthony Jesus and Barrera Maria
Current Estimated Value
Home Financials for this Owner
Home Financials are based on the most recent Mortgage that was taken out on this home.
Original Mortgage
$297,500
Outstanding Balance
$236,346
Interest Rate
3.68%
Mortgage Type
New Conventional
Estimated Equity
$612,271
Purchase Details
Closed on
May 2, 2002
Sold by
Freeland Margaret A and Margaret A Freeland Revocable
Bought by
Barrera Tony and Barrera Maria
Home Financials for this Owner
Home Financials are based on the most recent Mortgage that was taken out on this home.
Original Mortgage
$212,000
Interest Rate
6.94%
Purchase Details
Closed on
Oct 20, 1994
Sold by
Freeland Margaret A
Bought by
The Margaret A Freeland Revocable 1994 T
Create a Home Valuation Report for This Property
The Home Valuation Report is an in-depth analysis detailing your home's value as well as a comparison with similar homes in the area
Home Values in the Area
Average Home Value in this Area
Purchase History
| Date | Buyer | Sale Price | Title Company |
|---|---|---|---|
| Barrera Anthony Jesus | -- | First American Title Company | |
| Barrera Tony | $265,000 | -- | |
| The Margaret A Freeland Revocable 1994 T | -- | -- |
Source: Public Records
Mortgage History
| Date | Status | Borrower | Loan Amount |
|---|---|---|---|
| Open | Barrera Anthony Jesus | $297,500 | |
| Closed | Barrera Tony | $212,000 |
Source: Public Records
Tax History Compared to Growth
Tax History
| Year | Tax Paid | Tax Assessment Tax Assessment Total Assessment is a certain percentage of the fair market value that is determined by local assessors to be the total taxable value of land and additions on the property. | Land | Improvement |
|---|---|---|---|---|
| 2025 | $5,042 | $391,461 | $226,015 | $165,446 |
| 2024 | $5,042 | $383,786 | $221,584 | $162,202 |
| 2023 | $4,968 | $376,262 | $217,240 | $159,022 |
| 2022 | $4,902 | $368,885 | $212,981 | $155,904 |
| 2021 | $4,828 | $361,653 | $208,805 | $152,848 |
| 2019 | $4,709 | $350,927 | $202,612 | $148,315 |
| 2018 | $4,466 | $344,047 | $198,640 | $145,407 |
| 2016 | $4,206 | $330,689 | $190,928 | $139,761 |
| 2015 | $4,098 | $325,723 | $188,061 | $137,662 |
| 2014 | $4,046 | $319,344 | $184,378 | $134,966 |
Source: Public Records
Map
Nearby Homes
- 1147 W Badillo St Unit G
- 1147 W Badillo St Unit D
- 509 Tamarind Way Unit B
- 229 Scratch Rd
- 501 Embrook Way
- 708 N La Breda Ave
- 1122 W Glentana St
- 1327 E Thelborn St
- 1423 W San Bernardino Rd Unit A
- 650 N Vogue Ave
- 17022 E Edna Place
- 410 N Lyall Ave
- 675 N Lark Ellen Ave
- 1714 E Idahome St
- 1037 E Grovecenter St
- 4455 N Lark Ellen Ln
- 543 W Puente St Unit 3
- 1715 E Mardina St
- 511 W Puente St Unit 4
- 511 W Puente St Unit 1
- 728 N Butterfield Rd
- 742 N Butterfield Rd
- 735 N Leaf Ave
- 729 N Leaf Ave
- 724 N Butterfield Rd
- 743 N Leaf Ave
- 744 N Butterfield Rd
- 725 N Leaf Ave
- 718 N Butterfield Rd
- 729 N Butterfield Rd
- 735 N Butterfield Rd
- 1158 W Grovecenter St
- 1142 W Grovecenter St
- 743 N Butterfield Rd
- 719 N Leaf Ave
- 725 N Butterfield Rd
- 1166 W Grovecenter St
- 744 N Leaf Ave
- 1134 W Grovecenter St
- 1174 W Grovecenter St