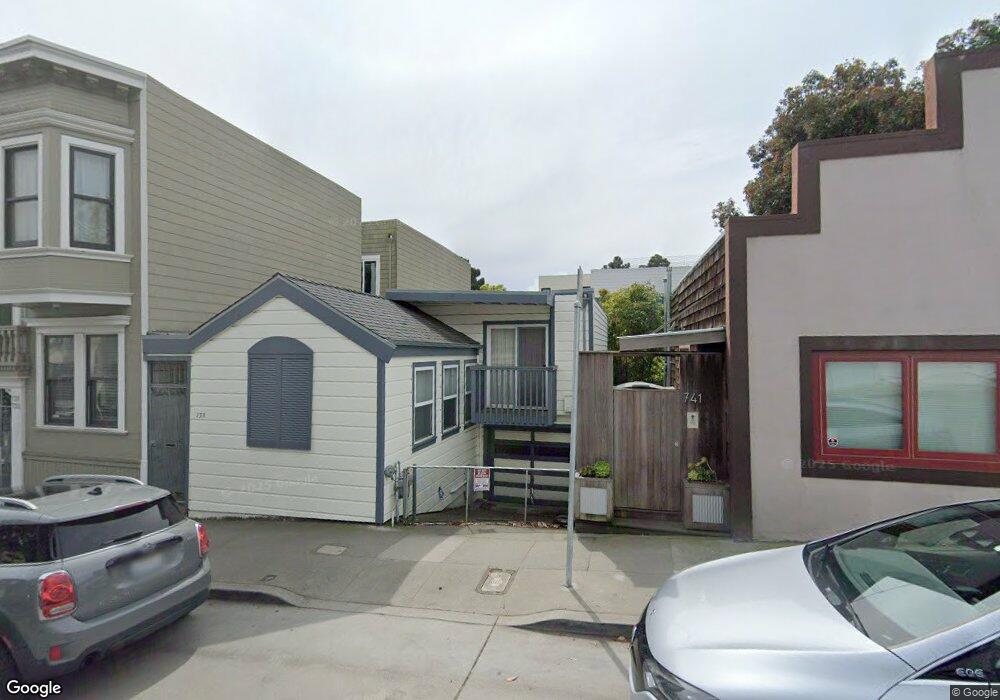
735 Chenery St San Francisco, CA 94131
Glen Park NeighborhoodEstimated Value: $858,000 - $1,302,000
2
Beds
1
Bath
672
Sq Ft
$1,597/Sq Ft
Est. Value
About This Home
This home is located at 735 Chenery St, San Francisco, CA 94131 and is currently estimated at $1,072,927, approximately $1,596 per square foot. 735 Chenery St is a home located in San Francisco County with nearby schools including Glen Park Elementary School, James Lick Middle School, and St John Catholic School.
Ownership History
Date
Name
Owned For
Owner Type
Purchase Details
Closed on
Oct 28, 2011
Sold by
Jeong Gwendolyn Khan
Bought by
Jeong Gwendolyn Khan
Current Estimated Value
Home Financials for this Owner
Home Financials are based on the most recent Mortgage that was taken out on this home.
Original Mortgage
$50,000
Interest Rate
3.95%
Mortgage Type
New Conventional
Create a Home Valuation Report for This Property
The Home Valuation Report is an in-depth analysis detailing your home's value as well as a comparison with similar homes in the area
Home Values in the Area
Average Home Value in this Area
Purchase History
| Date | Buyer | Sale Price | Title Company |
|---|---|---|---|
| Jeong Gwendolyn Khan | -- | Placer Title Company | |
| Jeong Gwendolyn Khan | -- | Placer Title Company |
Source: Public Records
Mortgage History
| Date | Status | Borrower | Loan Amount |
|---|---|---|---|
| Closed | Jeong Gwendolyn Khan | $50,000 |
Source: Public Records
Tax History Compared to Growth
Tax History
| Year | Tax Paid | Tax Assessment Tax Assessment Total Assessment is a certain percentage of the fair market value that is determined by local assessors to be the total taxable value of land and additions on the property. | Land | Improvement |
|---|---|---|---|---|
| 2025 | $3,137 | $270,592 | $199,125 | $71,467 |
| 2024 | $3,137 | $265,287 | $195,221 | $70,066 |
| 2023 | $3,092 | $260,087 | $191,394 | $68,693 |
| 2022 | $3,037 | $254,989 | $187,642 | $67,347 |
| 2021 | $2,984 | $249,990 | $183,963 | $66,027 |
| 2020 | $2,992 | $247,427 | $182,077 | $65,350 |
| 2019 | $2,891 | $242,576 | $178,507 | $64,069 |
| 2018 | $2,795 | $237,820 | $175,007 | $62,813 |
| 2017 | $2,762 | $233,158 | $171,576 | $61,582 |
| 2016 | $2,692 | $228,587 | $168,212 | $60,375 |
| 2015 | $2,659 | $225,155 | $165,686 | $59,469 |
| 2014 | $2,589 | $220,746 | $162,441 | $58,305 |
Source: Public Records
Map
Nearby Homes
- 43 Sussex St
- 101 Moffitt St
- 246 Bemis St
- 54-56 Monterey Blvd
- 58 Monterey Blvd
- 200 Cayuga Ave
- 25 Mizpah St
- 474 Arlington St Unit 478
- 8 Mateo St
- 101 Farnum St
- 360 Laidley St Unit 362
- 222 Monterey Blvd
- 35 Admiral Ave
- 225 Cotter St
- 408 Gold Mine Dr
- 78 Theresa St
- 37 Miguel St Unit 6
- 30 Harry St
- 95 Ora Way Unit 303F
- 144 Laidley St