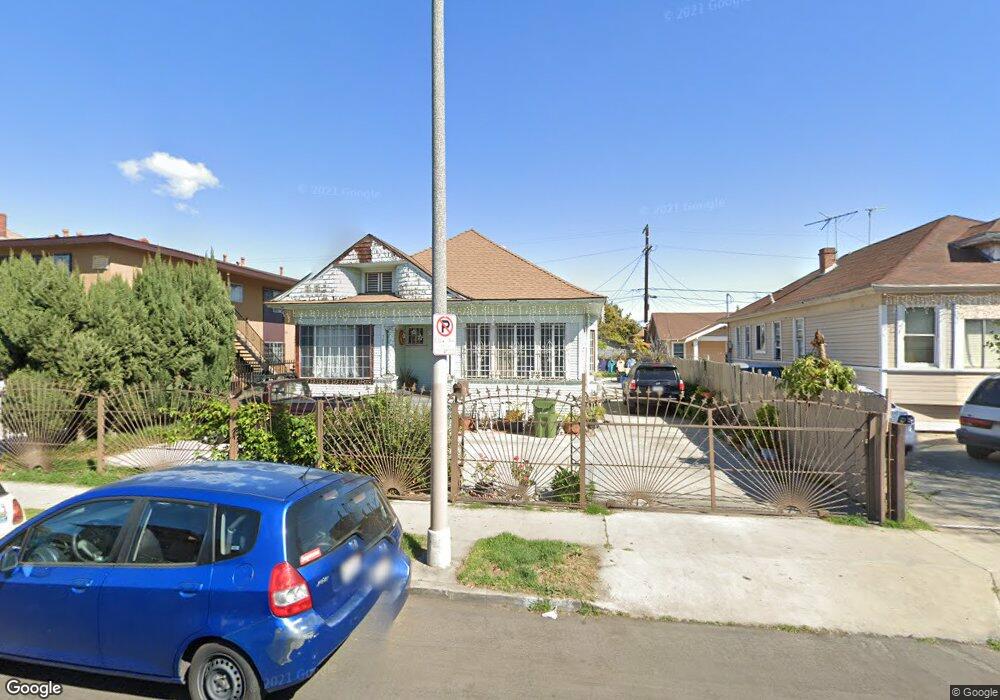
735 E 25th St Los Angeles, CA 90011
Historic South Central NeighborhoodEstimated Value: $635,000 - $756,000
2
Beds
1
Bath
1,086
Sq Ft
$641/Sq Ft
Est. Value
About This Home
This home is located at 735 E 25th St, Los Angeles, CA 90011 and is currently estimated at $696,209, approximately $641 per square foot. 735 E 25th St is a home located in Los Angeles County with nearby schools including San Pedro Street Elementary School, John Adams Middle School, and Santee Education Complex.
Ownership History
Date
Name
Owned For
Owner Type
Purchase Details
Closed on
Oct 24, 2003
Sold by
Villeda Oscar A
Bought by
Beltranena Rafael and Rodriguez Alicia I
Current Estimated Value
Home Financials for this Owner
Home Financials are based on the most recent Mortgage that was taken out on this home.
Original Mortgage
$116,000
Interest Rate
5.98%
Mortgage Type
Purchase Money Mortgage
Purchase Details
Closed on
Apr 8, 1993
Sold by
Lowry Lane
Bought by
Beltranena Rafael and Rodriguez Alicia J
Home Financials for this Owner
Home Financials are based on the most recent Mortgage that was taken out on this home.
Original Mortgage
$128,544
Interest Rate
7.34%
Mortgage Type
FHA
Create a Home Valuation Report for This Property
The Home Valuation Report is an in-depth analysis detailing your home's value as well as a comparison with similar homes in the area
Home Values in the Area
Average Home Value in this Area
Purchase History
| Date | Buyer | Sale Price | Title Company |
|---|---|---|---|
| Beltranena Rafael | -- | First American Title Co | |
| Rodriguez Alicia I | -- | -- | |
| Beltranena Rafael | $134,000 | Southern California Title Co |
Source: Public Records
Mortgage History
| Date | Status | Borrower | Loan Amount |
|---|---|---|---|
| Closed | Beltranena Rafael | $116,000 | |
| Previous Owner | Beltranena Rafael | $128,544 |
Source: Public Records
Tax History Compared to Growth
Tax History
| Year | Tax Paid | Tax Assessment Tax Assessment Total Assessment is a certain percentage of the fair market value that is determined by local assessors to be the total taxable value of land and additions on the property. | Land | Improvement |
|---|---|---|---|---|
| 2025 | $3,162 | $239,375 | $167,787 | $71,588 |
| 2024 | $3,162 | $234,683 | $164,498 | $70,185 |
| 2023 | $3,106 | $230,082 | $161,273 | $68,809 |
| 2022 | $2,970 | $225,571 | $158,111 | $67,460 |
| 2021 | $2,932 | $221,149 | $155,011 | $66,138 |
| 2019 | $2,850 | $214,591 | $150,414 | $64,177 |
| 2018 | $2,720 | $210,384 | $147,465 | $62,919 |
| 2017 | $2,661 | $206,260 | $144,574 | $61,686 |
| 2016 | $2,594 | $202,217 | $141,740 | $60,477 |
| 2015 | $2,558 | $199,180 | $139,611 | $59,569 |
| 2014 | $2,575 | $195,280 | $136,877 | $58,403 |
Source: Public Records
Map
Nearby Homes