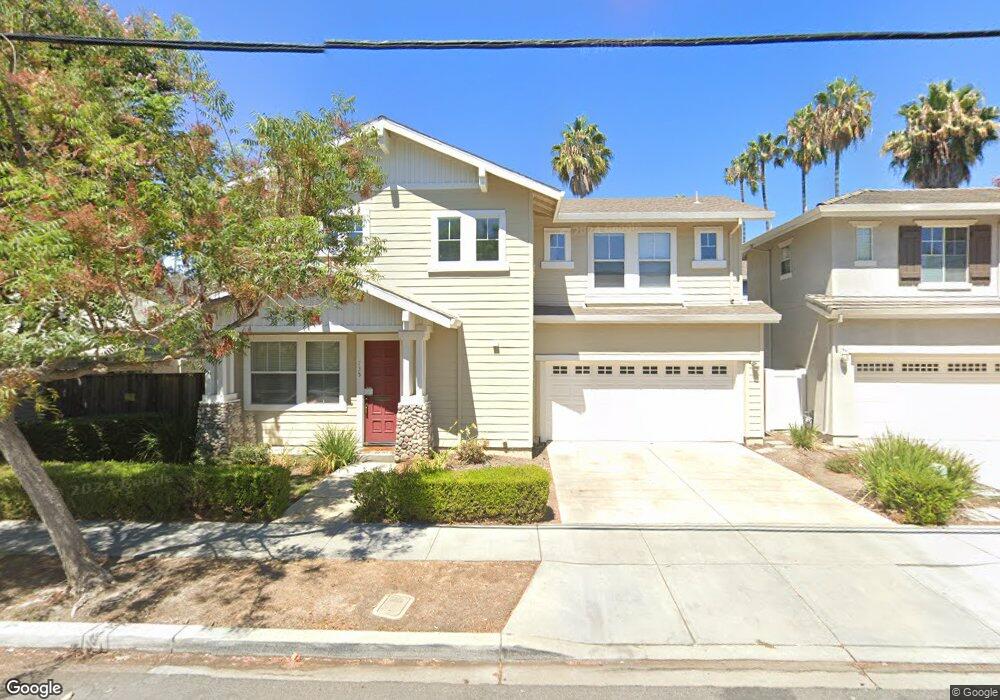
735 E San Fernando St San Jose, CA 95112
Naglee Park NeighborhoodEstimated Value: $1,170,000 - $1,257,000
3
Beds
3
Baths
1,389
Sq Ft
$868/Sq Ft
Est. Value
About This Home
This home is located at 735 E San Fernando St, San Jose, CA 95112 and is currently estimated at $1,206,224, approximately $868 per square foot. 735 E San Fernando St is a home located in Santa Clara County with nearby schools including Horace Mann Elementary School, Muwekma Ohlone Middle, and San Jose High School.
Ownership History
Date
Name
Owned For
Owner Type
Purchase Details
Closed on
Dec 8, 2020
Sold by
Raymundo Edilberto Silverio and Raymundo Bettina Santos
Bought by
Raymundo Edilberto Silverio and Raymundo Bettina Santos
Current Estimated Value
Purchase Details
Closed on
Dec 18, 2002
Sold by
Santos Santos Jr Ravenal Jr Ravenal and Santos Raymundo Bettina
Bought by
Santos Raymundo Jr Edilberto Silverio and Santos Raymundo Bettina
Home Financials for this Owner
Home Financials are based on the most recent Mortgage that was taken out on this home.
Original Mortgage
$207,000
Outstanding Balance
$86,482
Interest Rate
5.86%
Estimated Equity
$1,119,742
Purchase Details
Closed on
Jun 30, 1998
Sold by
Naglee Park Lp
Bought by
Santos Ravenal and Santos Scarlet V
Home Financials for this Owner
Home Financials are based on the most recent Mortgage that was taken out on this home.
Original Mortgage
$215,900
Interest Rate
7.06%
Create a Home Valuation Report for This Property
The Home Valuation Report is an in-depth analysis detailing your home's value as well as a comparison with similar homes in the area
Home Values in the Area
Average Home Value in this Area
Purchase History
| Date | Buyer | Sale Price | Title Company |
|---|---|---|---|
| Raymundo Edilberto Silverio | -- | None Available | |
| Santos Raymundo Jr Edilberto Silverio | $103,500 | Chicago Title | |
| Santos Ravenal | $316,000 | First American Title Guarant |
Source: Public Records
Mortgage History
| Date | Status | Borrower | Loan Amount |
|---|---|---|---|
| Open | Santos Raymundo Jr Edilberto Silverio | $207,000 | |
| Closed | Santos Ravenal | $215,900 |
Source: Public Records
Tax History Compared to Growth
Tax History
| Year | Tax Paid | Tax Assessment Tax Assessment Total Assessment is a certain percentage of the fair market value that is determined by local assessors to be the total taxable value of land and additions on the property. | Land | Improvement |
|---|---|---|---|---|
| 2025 | $7,152 | $493,880 | $186,994 | $306,886 |
| 2024 | $7,152 | $484,197 | $183,328 | $300,869 |
| 2023 | $6,994 | $474,704 | $179,734 | $294,970 |
| 2022 | $6,926 | $465,397 | $176,210 | $289,187 |
| 2021 | $6,753 | $456,272 | $172,755 | $283,517 |
| 2020 | $6,576 | $451,594 | $170,984 | $280,610 |
| 2019 | $6,421 | $442,740 | $167,632 | $275,108 |
| 2018 | $6,346 | $434,060 | $164,346 | $269,714 |
| 2017 | $6,286 | $425,550 | $161,124 | $264,426 |
| 2016 | $6,127 | $417,207 | $157,965 | $259,242 |
| 2015 | $6,079 | $410,941 | $155,593 | $255,348 |
| 2014 | $5,643 | $402,893 | $152,546 | $250,347 |
Source: Public Records
Map
Nearby Homes
- 188 S 14th St
- 850 Calhoun St
- 101 S 13th St
- 551 S 15th St
- 339 S 13th St
- 18 S 21st St Unit 200
- 415 S 14th St
- 30 S 22nd St Unit 6
- 30 S 22nd St Unit 2
- 384 S 11th St
- 39 S 23rd St
- 396 S 18th St
- 431 E Saint John St
- 214 S 22nd St
- 199 S 23rd St
- 55 Carnegie Square
- 842 E Julian St
- 915 E Julian St
- 431 S 11th St
- 987 E William St
- 87 S 16th St
- 745 E San Fernando St
- 89 S 16th St
- 711 E San Fernando St
- 83 S 16th St
- 101 S 16th St
- 81 S 16th St
- 720 E San Fernando St
- 88 S 15th St
- 77 S 16th St
- 109 S 16th St
- 79 S 16th St
- 710 E San Fernando St
- 74 S 15th St
- 765 E San Fernando St
- 110 S 15th St
- 115 S 16th St
- 88 S 16th St
- 73 S 16th St
- 71 S 16th St