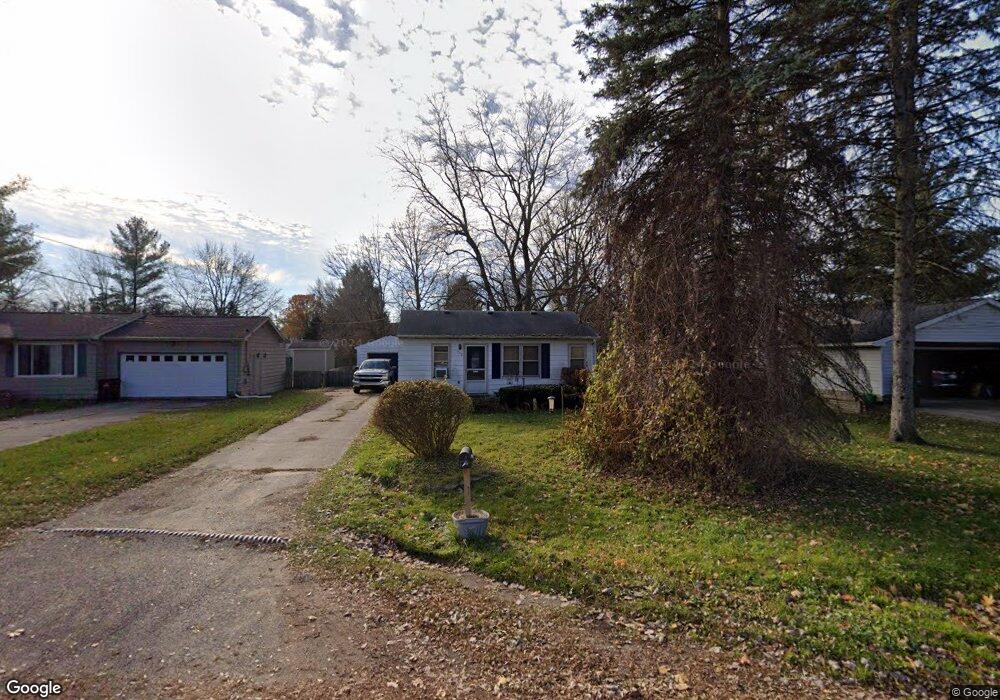
735 Fisher Dr Lansing, MI 48911
Southern Lansing NeighborhoodEstimated Value: $88,228 - $127,000
--
Bed
--
Bath
672
Sq Ft
$173/Sq Ft
Est. Value
About This Home
This home is located at 735 Fisher Dr, Lansing, MI 48911 and is currently estimated at $116,057, approximately $172 per square foot. 735 Fisher Dr is a home located in Ingham County with nearby schools including Horizon Elementary School, Washington Woods Middle School, and Holt Junior High School.
Ownership History
Date
Name
Owned For
Owner Type
Purchase Details
Closed on
Aug 24, 2001
Sold by
Lenon James S and Lenon Jamie L
Bought by
Wise James C and Wise Linda J
Current Estimated Value
Home Financials for this Owner
Home Financials are based on the most recent Mortgage that was taken out on this home.
Original Mortgage
$74,600
Outstanding Balance
$28,911
Interest Rate
7.06%
Mortgage Type
FHA
Estimated Equity
$87,146
Purchase Details
Closed on
Aug 5, 1999
Sold by
Mathis Robert W and Mathis Lynne Loretta
Bought by
Lenon James S and Lenon Jamie L
Home Financials for this Owner
Home Financials are based on the most recent Mortgage that was taken out on this home.
Original Mortgage
$48,773
Interest Rate
7.7%
Mortgage Type
FHA
Create a Home Valuation Report for This Property
The Home Valuation Report is an in-depth analysis detailing your home's value as well as a comparison with similar homes in the area
Home Values in the Area
Average Home Value in this Area
Purchase History
| Date | Buyer | Sale Price | Title Company |
|---|---|---|---|
| Wise James C | $75,200 | -- | |
| Lenon James S | $48,307 | First American Title Ins Co |
Source: Public Records
Mortgage History
| Date | Status | Borrower | Loan Amount |
|---|---|---|---|
| Open | Wise James C | $74,600 | |
| Previous Owner | Lenon James S | $48,773 |
Source: Public Records
Tax History Compared to Growth
Tax History
| Year | Tax Paid | Tax Assessment Tax Assessment Total Assessment is a certain percentage of the fair market value that is determined by local assessors to be the total taxable value of land and additions on the property. | Land | Improvement |
|---|---|---|---|---|
| 2025 | $2,012 | $48,800 | $11,000 | $37,800 |
| 2024 | $16 | $46,900 | $11,000 | $35,900 |
| 2023 | $1,888 | $43,200 | $11,000 | $32,200 |
| 2022 | $1,706 | $38,400 | $8,800 | $29,600 |
| 2021 | $1,670 | $36,200 | $5,600 | $30,600 |
| 2020 | $1,660 | $33,200 | $5,600 | $27,600 |
| 2019 | $1,589 | $29,900 | $5,600 | $24,300 |
| 2018 | $1,492 | $28,200 | $5,600 | $22,600 |
| 2017 | $1,427 | $28,200 | $5,600 | $22,600 |
| 2016 | $1,365 | $25,000 | $5,600 | $19,400 |
| 2015 | $1,365 | $24,100 | $11,187 | $12,913 |
| 2014 | $1,365 | $23,600 | $16,486 | $7,114 |
Source: Public Records
Map
Nearby Homes
- 6819 Richard Rd
- 6421 S Washington Ave
- 6444 Sommerset Rd
- 6270 S Washington Ave
- 6429 Rosedale Rd
- 2626 Little Hickory Dr
- 1119 W Miller Rd
- 2340 Washington Rd
- 6246 Gardenia Ave
- 6029 Ellendale Dr
- 5902 Hilliard Rd
- 218 Raritan Rd
- 1020 R G Curtiss Ave
- 2416 Houghton Hollow Dr
- 6037 Hughes Rd
- 5041 Willoughby Rd Unit 4
- 5727 Annapolis Dr
- 5636 Ellendale Dr
- 5730 Laporte Dr
- 921 E Willoughby Rd